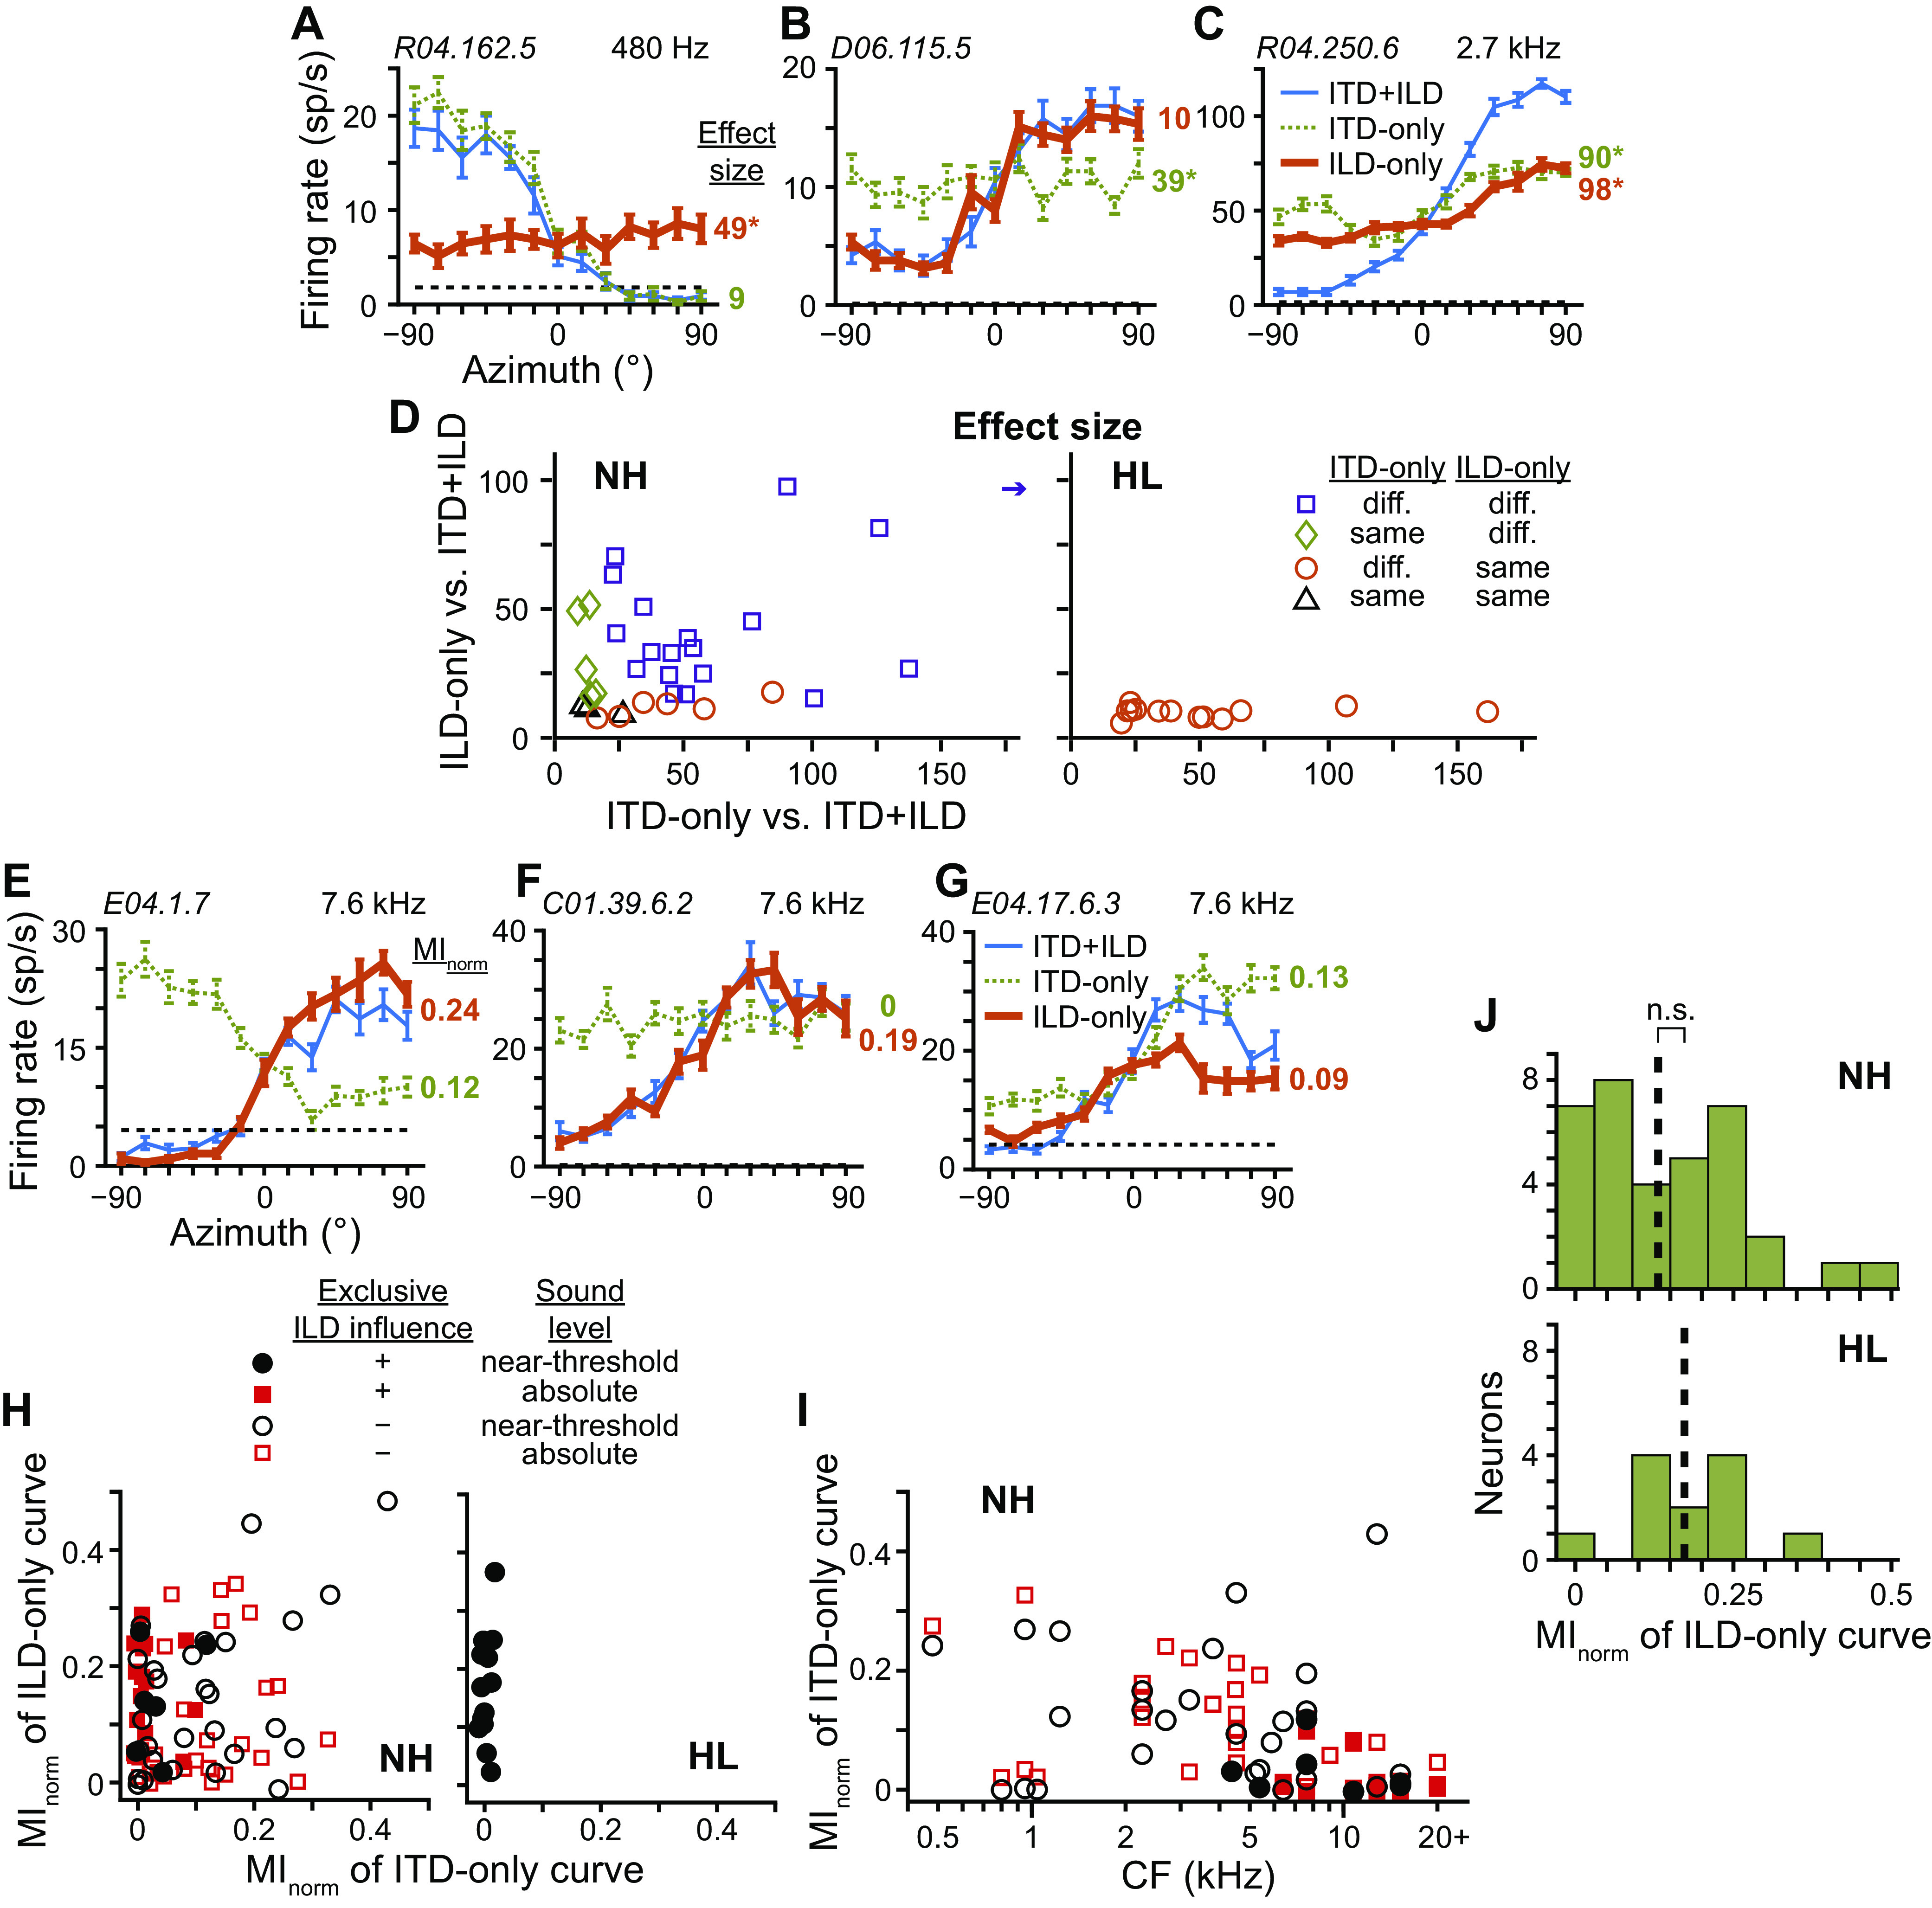
Fig. 6.

Binaural cues underlying directional sensitivity. A–C: azimuth tuning curves of 3 different neurons measured at near-threshold level under congruent [blue thin lines; interaural time and level differences (“ITD + ILD”)] and 2 incongruent binaural cue conditions, where in the latter cases only either ITD (green dotted lines; “ITD only”) or ILD (orange thick lines; “ILD only”) varied with azimuth while the other cue was fixed to that at 0°. Broken lines indicate spontaneous rate. Data in A and C were from normal-hearing (NH) rabbits with CF indicated in top right corner, whereas data in B were from a hearing loss (HL) rabbit. Unit ID indicated in top left corner. Effect sizes of Wald tests for differences between ITD + ILD and each of ITD-only and ILD-only curves are listed to the right of each panel, color-matched to each incongruent-cue curve. *P < 0.01. D: scatterplots of the effect size between congruent- and incongruent-cue curves of neurons from NH (left; N = 34) and HL (right; N = 13) rabbits measured at near-threshold level. Only neurons with ITD + ILD curves that were significantly different from both spontaneous rate and contra-only curves were included (i.e., above threshold and binaural). Statistically significant differences (P < 0.01, Wald tests with correction for multiple comparisons) between the ITD + ILD and each of the ITD-only and ILD-only curves indicated by symbol shape and color: both different (purple squares), only ILD-only different (green diamonds), only ITD-only different (orange circles), neither different (black triangles). Arrow indicates data point beyond the axis. E–G: azimuth tuning curves of 3 additional neurons from NH rabbits. Format same as in A–C. Data in E and G are measured at near-threshold level and F at absolute level. Normalized mutual information (MInorm) for ITD-only and ILD-only curves listed to the right of each panel, color-matched to each incongruent-cue curve. H: scatterplot of MInorm for ITD-only versus ILD-only curves for each neuron from NH (left) and HL (right) rabbits. Only neurons with ITD + ILD curves that were significantly different from both spontaneous rate and contra-only curves were included. Solid symbols indicate neurons whose ITD + ILD curves were significantly different from their ITD-only but not ILD-only curves while open symbols indicate all other neurons. Black circles and red squares indicate measurement at near-threshold (NH: N = 34; HL: N = 13) and absolute (NH: N = 42) sound levels, respectively. I: scatterplot of MInorm for ITD-only curves versus the CF of each neuron from NH rabbits. Symbols same as in H. J: histograms of MInorm for ILD-only tuning curves of neurons from NH (N = 35) and HL (N = 12) rabbits measured at near-threshold level. Only neurons with ILD-only curves that were significantly different from both spontaneous rate and contra-only curves were included. Broken lines indicate medians. ns, No statistical significance (P > 0.05, Wilcoxon rank-sum test).
