Fig. 9.
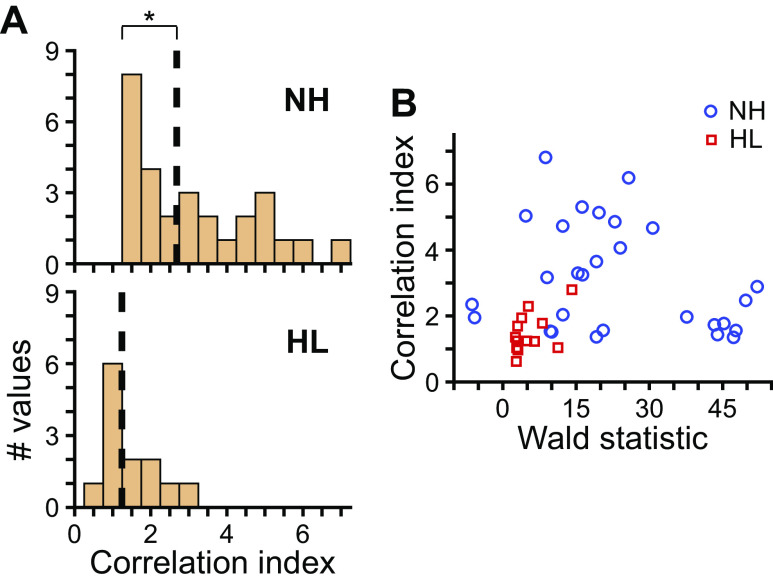
Spike-timing precision following noise overexposure. A: histograms of correlation indexes of responses to monaural broadband noise at near-threshold level for neurons from normal-hearing (NH, top; N = 28 values from 15 neurons) and hearing loss (HL, bottom; N = 13 values from 11 neurons) rabbits. Data pooled across ipsi- and contralateral presentation. Values only included for responses that both significantly deviated from spontaneous rate (i.e., above threshold; P < 0.01, Wald test) and had sufficient total number of spikes to accurately estimate correlation index (see materials and methods). Broken lines indicate medians. *P < 0.05 (Wilcoxon rank-sum test). B: scatterplot of correlation index versus Wald statistic computed on firing rate to monaural noise and spontaneous rate (see materials and methods). The Wald statistic is a difference of firing rates scaled by a factor that accounts for the increase in firing rate variability with mean firing rate. Data from NH and HL rabbits indicated by blue circles and red squares, respectively.

