Fig. 5.
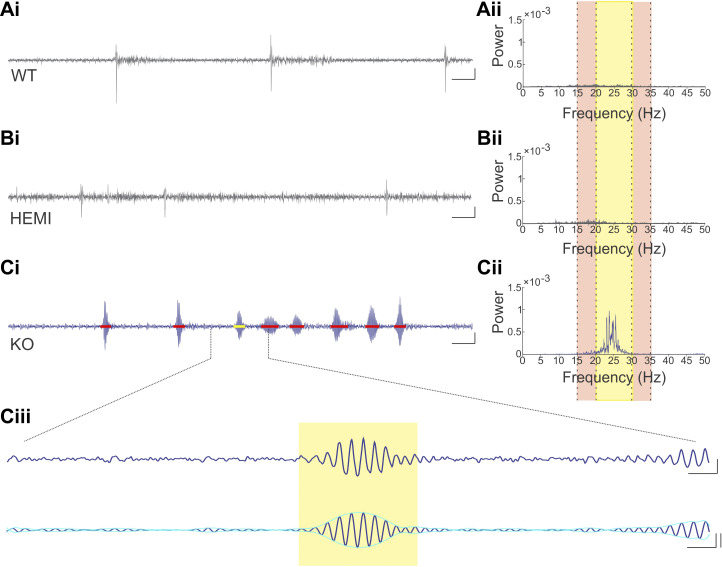
Tremor is visible in PC-KO-Mixed animals. Example raw traces (i) from wild-type (WT; A), hemizygous (HEMI; B), and knockout (KO; C) animals, and corresponding power spectral density (PSD) plots (ii). Yellow highlighted region (ii) represents the tremor band (20–30 Hz); adjacent reference bands are highlighted in the light tan color (15–20 Hz and 30–35 Hz). The tremor band ratio (TBR) is the ratio of the power in the tremor band to the power in these adjacent bands. In the KO animal, there is a clear increase in power in the tremor band relative to the adjacent bands (Cii), and relative to WT (Aii) and HEMI (Bii) animals. Note that the PSD plot is present for both WT and HEMI animals, but it is difficult to see as it hovers near zero in the plots. In KO animals, bouts of tremor were present (Ci; detected tremor bouts are indicated by red bars; yellow bar highlights the tremor bout expanded in Ciii). While periods of (nontremor) movements are visible in Ai and Bi, these were not associated with strong oscillatory signals and were not detected as tremor bouts. Ciii: an expanded view of a tremor bout, showing both the wideband trace (top) and the signal filtered to the tremor band (20–30 Hz; bottom trace). The yellow box indicates the detected tremor bout, with onset and offset determined by the envelope of the filtered signal (aqua overlay). Note that the beginning of the next tremor bout is visible to the far right and is not marked. Scale bars: Ai, Bi, Ci: 1 s; 20% change in force. Ciii, top: 100 ms; 20% change in force. Ciii, bottom: 100 ms; 20% change in force, left vertical; 3 SD, right vertical. HEMI, hemizygous; KO, knockout; PC, Purkinje cell; WT, wild-type.

