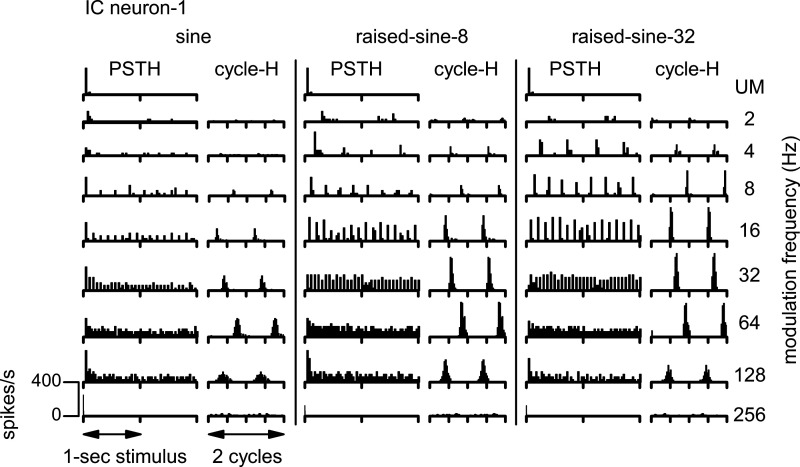
Fig. 4.
Poststimulus time histograms (PSTH) and cycle histograms (cycle-H) of responses of a band-enhanced inferior colliculus (IC) neuron (neuron-1) represented in Fig. 3. The noise was unmodulated (UM; top row) or amplitude-modulated (rows 2–9). Three different modulation envelopes were used: a sine function (left), raised-sine-8 (middle), and raised-sine-32 (right). The stimulus, consisting of 1-s noise bursts followed by 0.8-s silent intervals, was presented twice monaurally to the ear contralateral to the neural recording site. Bin width for the PSTHs was 16.1 ms; bin width for the cycle-Hs was 1/32 cycle.

