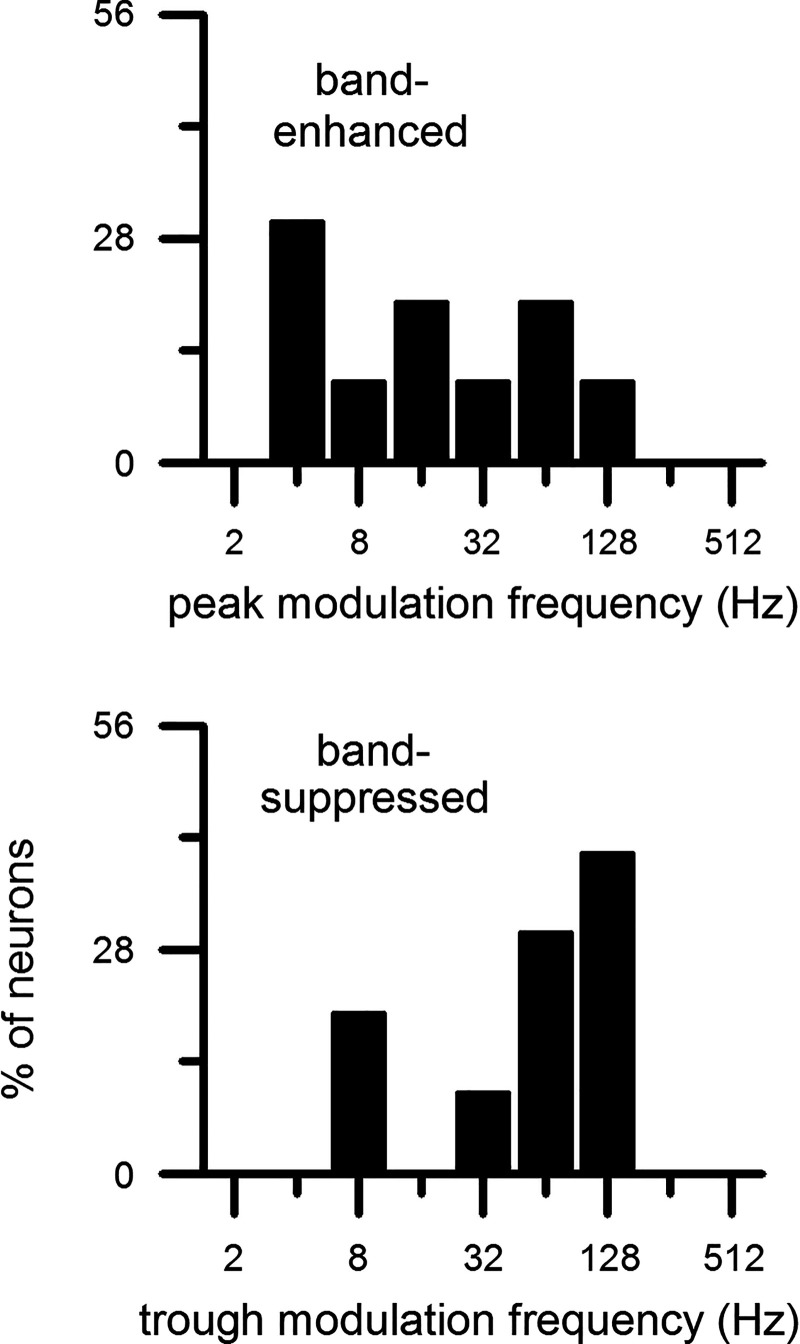
Fig. 17.
Distributions of peak (top) and trough (bottom) modulation frequencies of band-enhanced (n = 10) and band-suppressed (n = 10) medial geniculate body neurons, respectively, defined with a 1.2 criterion. The stimulus envelope was sinusoidal. Median peak modulation frequency was 16 Hz, and median trough modulation frequency was 64 Hz.

