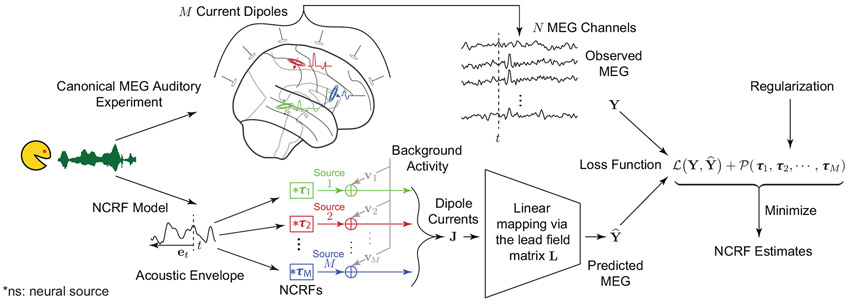
Figure 2:
Schematic depiction of the proposed modeling and estimation framework. Upper branch: the experimental setting in which the subject is listening to speech while MEG neural responses are being recorded. Lower branch: the modeling framework in which the speech waveform is transformed into a feature variable representation, and is thereby processed via M linear filters (i.e., NCRFs) to generate time-varying current dipoles at each of the corresponding M source locations. Note that each NCRF in the lower branch corresponds to a 3D vector of dipole activity with a specific temporal profile, as shown in the upper branch with matching colors. These dipoles give rise to the predicted MEG response via a source-to-sensor mapping (i.e., the lead-field matrix). The two branches converge on the right hand side, where the NCRFs are estimated by minimizing a regularized loss function.

