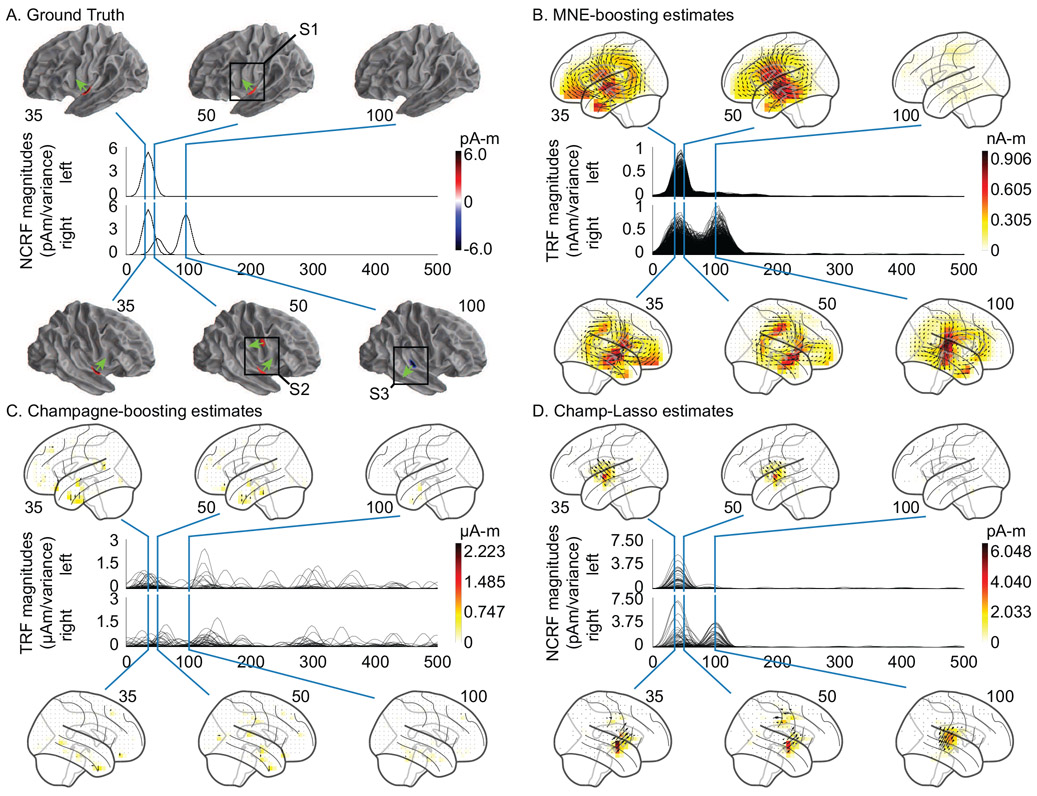
Figure 3:
Results for a simulated auditory experiment. The top and bottom portions of each subplot pertain to the left and right hemispheres, respectively. A. The anatomical plots show the simulated neural sources normal to cortical surface, and the traces show the overlaid temporal profiles. The colorbar encodes directional intensity normal to the cortical surface (shown by the green arrows). B & C. The two-stage localized (i.e. MNE-boosting, and one of its variants, Champagne-boosting, respectively) TRFs (free-orientation) are shown on the anatomical plots, where the 3D dipoles are projected onto the lateral plane. D. NCRF estimates from the Champ-Lasso algorithm. The colorbar encodes dipole magnitudes. The spatial extent, dipole moment scale, temporal profile, and orientations of the neural sources are faithfully recovered by the Champ-Lasso algorithm, whereas the two-stage localized TRFs are either spatially dispersed (MNE-boosting) or overly sparse (Champagne-boosting) and exhibit spurious peaks in the anterior temporal and inferior frontal lobes.

