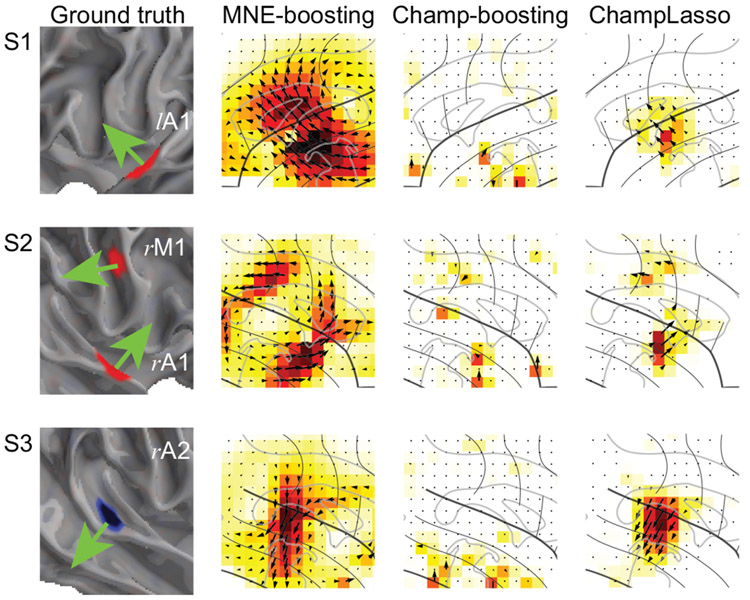
Figure 4:
Results for the simulated auditory experiment (continued): Zoomed in views of the active cortical patches (marked as S1, S2 and S2 in Fig. 3A) emphasizing the orientations of the simulated current dipoles (green arrows) alongside the estimated current dipole directions.

