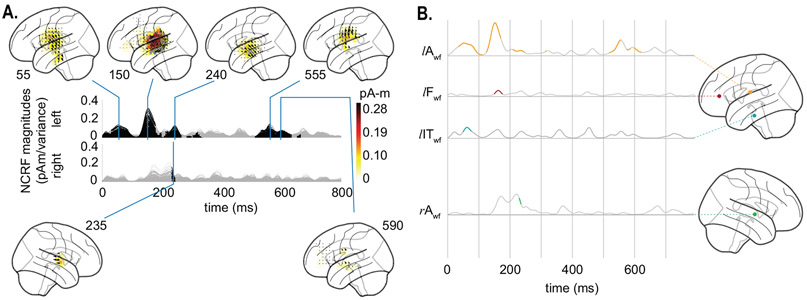
Figure 6:
Estimated NCRFs for the word frequency feature variable. A. The anatomical plots show the group-level average NCRFs projected onto the lateral plane (top and bottom panels) corresponding to selected visually salient peaks in the temporal profiles (middle panels). The top and bottom portions of the subplot pertain to left and right hemisphere, respectively. Numerical labels of each anatomical subplot indicates the corresponding time lag in ms. B. The time traces show the temporal profile of 4 selected NCRFs exhibiting peak spatial activity (collapsed across time), grouped by hemisphere and and dorsoventrally ordered. The locations of the selected NCRFs are shown on the anatomical plots, with colors matching the time traces and linked by dashed lines. The anatomical plots show the locations of the selected NCRFs with colors matching the time traces. The gray portions of the traces in both subplots indicate statistically insignificant NCRFs at the group level (significance level of 5%). The prominent NCRFs manifest in the left hemisphere, dominated by an auditory component at ~ 150 ms. See Supplementary Movie 02 for a detailed animation showing how the word frequency NCRF components change as function of time lags.

