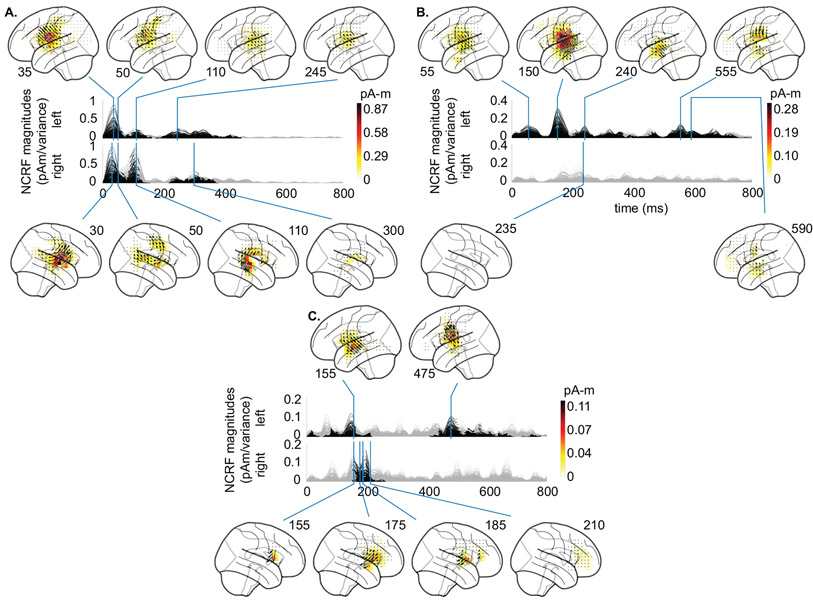
Figure C.9:
Estimated NCRFs for acoustic envelope (A), word frequency (B), semantic composition (C): The anatomical plots show the group-level average NCRFs projected onto the lateral plane (top and bottom panels) corresponding to selected visually salient peaks in the temporal profiles (middle panels). The top and bottom portions of the subplot pertain to left and right hemisphere, respectively. Numerical labels of each anatomical subplot indicates the corresponding time lag in ms. The gray portions of the traces indicate statistically insignificant NCRFs at the group level (significance level of 5%). The significance levels are computed using the Vector Test, as opposed to the main manuscript where the significance levels are based on the Length Test. The main features of the NCRFs discussed in the Results section are similarly recovered by the Vector Test.

