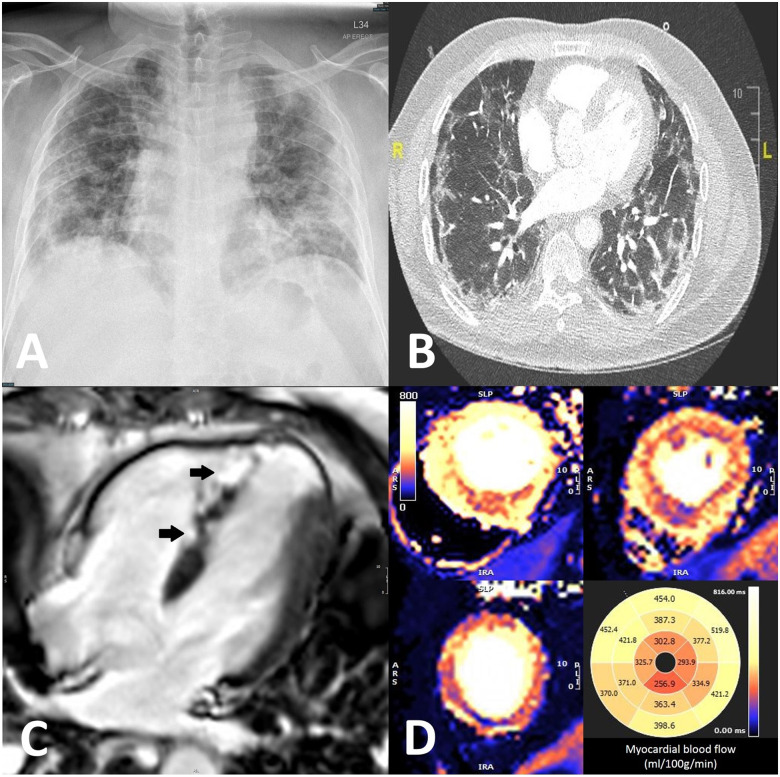
Figure 1.
(A) Chest radiograph on Day 1 showing diffuse bilateral pulmonary opacities. (B) Computed tomography pulmonary angiogram on Day 10 showed patchy peripheral ground-glass opacities with multiple bilateral pulmonary emboli. (C) Late gadolinium enhancement showing patchy micro-infarction in the mid septum on the epicardial right ventricular side (arrows). (D) Marked hyperaemic myocardial blood flow (up to 5 mL/g/min) with patchy apical and mid septal hypoperfusion.

