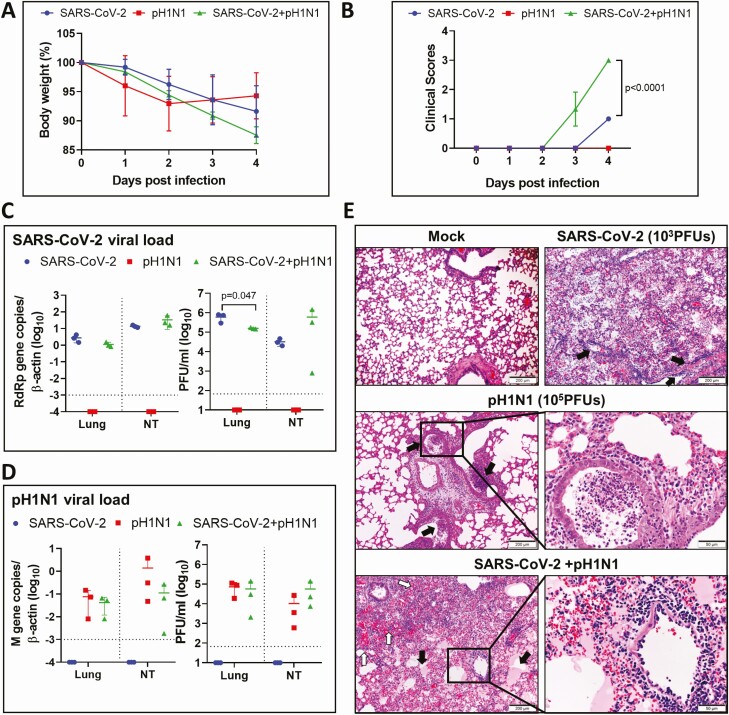
Figure 2.
Simultaneous coinfection of hamsters by higher doses of severe acute respiratory syndrome coronavirus 2 (SARS-CoV-2) and mouse-adapted A/Hongkong/415742/2009 H1N1 (pH1N1). Groups of hamsters were intranasally inoculated with 50 µL of SARS-CoV-2 (103 plaque-forming units [PFUs]) and pH1N1 (105 PFUs) mixture; the animals were monitored for body weight and clinical sign scores, and killed at 4 days postinfection (dpi). Monoinfection by either viruses were included as controls. A, Body weight changes during the 5-day experimental period. Weight on day 0 before virus inoculation was taken as 100%. n = 3 each group. Error bars indicate mean ± standard deviation. B, Average clinical scores for disease signs including lethargy, ruffled fur, hunchback posture, and rapid breathing. A score of 1 was given to each of these clinical signs. P value was calculated by 2-way analysis of variance. C, SARS-CoV-2 viral load in homogenized lung or nasal turbinate (NT) tissues at 4 dpi after monoinfection or coinfection. Right panels are SARS-CoV-2 RdRp gene copies determined by real-time reverse-transcription polymerase chain reaction (RT-qPCR). The left panels are infectious viral titers determined by plaque assays in Vero E6 cells. P value was calculated by Student t test. Horizontal dashed line indicates detection limit of the assays. D, pH1N1 viral load in lung and nasal turbinate (NT) by RT-qPCR (right panel), or plaque assays in Madin-Darby canine kidney cells (left panel). Horizontal dashed line indicates detection limit of the assays. E, Representative images of lung histopathological changes at 4 dpi after monoinfection or coinfection. Top left image shows the normal lung structure of mock control. SARS-CoV-2 (103 PFUs) monoinfection showed diffuse alveolitis with massive alveolar space inflammatory cell infiltration, exudation, and pulmonary vasculitis (arrows, top right image). pH1N1 (105 PFUs)–infected lung showed conspicuous bronchiolar luminal cell debris (arrows), mild peribronchiolar infiltration, and perivascular edema; a bronchiole section inside the boxed area filled with cell debris is shown in magnified image. Images in the bottom panels are SARS-CoV-2+pH1N1-coinfected lung tissue, which showed massive exudation of protein-rich fluid (pink color) filling alveolar space (solid arrows), and a large area of alveolar hemorrhage (open arrows). Boxed area is magnified showing endotheliitis in a blood vessel.

