
FIGURE 3.
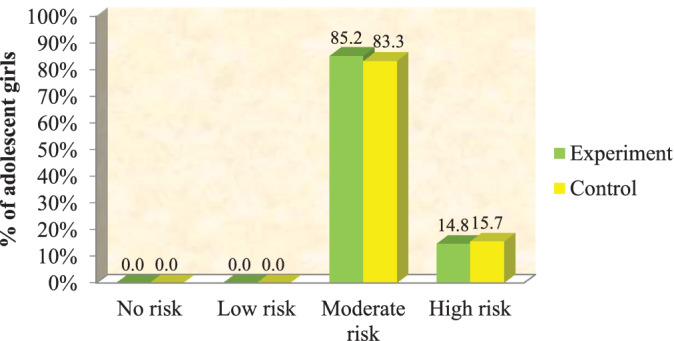
Pretest level of risk assessment in both the groups (n = 204). Note: Chi‐square test = 0.15 DF = 1 P = .70 (no significant P > .05)
Official websites use .gov
A
.gov website belongs to an official
government organization in the United States.
Secure .gov websites use HTTPS
A lock (
) or https:// means you've safely
connected to the .gov website. Share sensitive
information only on official, secure websites.
Pretest level of risk assessment in both the groups (n = 204). Note: Chi‐square test = 0.15 DF = 1 P = .70 (no significant P > .05)