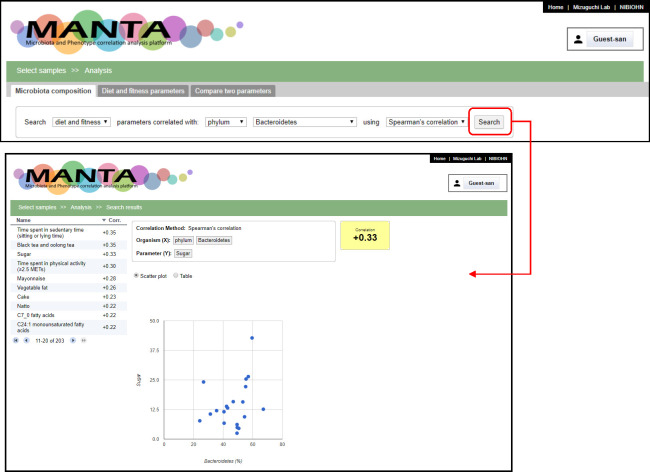
Fig 2. Correlation search for Bacteroidetes.
The table in the left part of the search results shows the correlation coefficient in descending order. The user can toggle the order by clicking on the column header. The right part shows the scatter plot for Bacteroidetes relative abundance and the selected parameter (sugar intake in this example).

