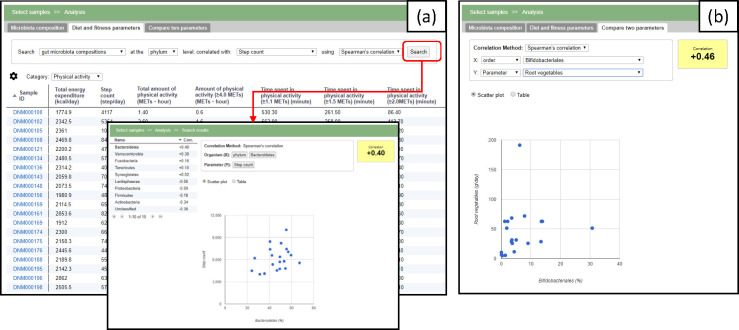
Fig 4. Screenshots of the other two tabs.
(a) The phenotypic parameters can be browsed in the ‘Phenotypic parameters’ tab. The user can examine the correlations to the microbiota composition for a selected parameter. (b) In the ‘Compare two parameters’ tab, the correlation of any combination of the taxa or parameter is calculated and also displayed in a scatter plot.

