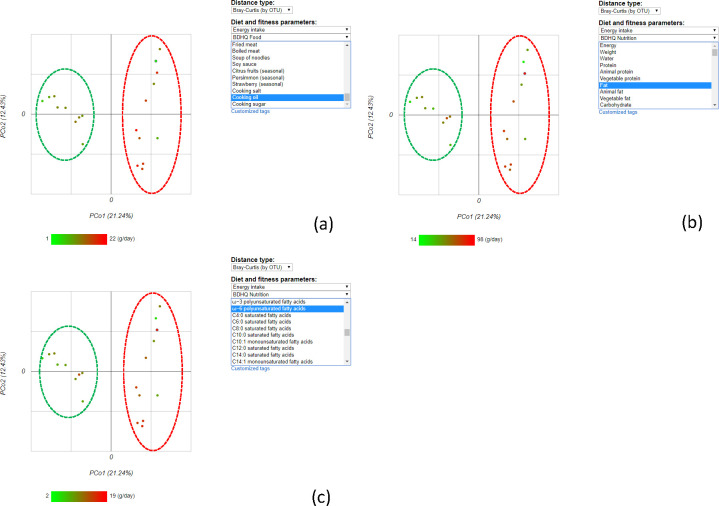
Fig 5. Relationship between microbiome composition and fat intake as detected by Principal Coordinate Analysis (PCoA).
The dots are colored by the energy intake from (a) cooking oil, (b) fat, and (c) ω-6 polyunsaturated fatty acids. The coloring suggests that the participants could be separated into two groups, namely, High-fat (red dashed circle) and low-fat consumption (green dashed circle).

