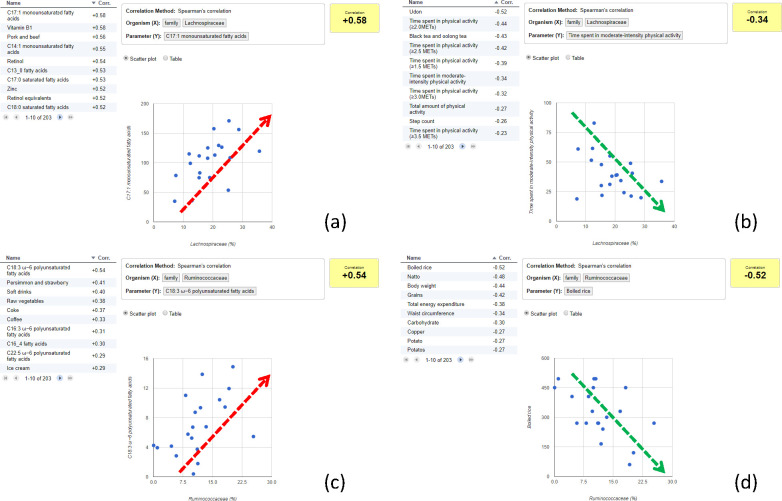
Fig 7. Search of ‘diet and physical activity parameters’ that correlate with Lachnospiraceae or Ruminococcaceae.
(a) Positive correlation between monounsaturated fatty acids (MUFAs) and Lachnospiraceae. The table (left) shows the top 10 positively correlated parameters. The scatter plot (right) shows the relationship between Lachnospiraceae (x-axis) and C17:1 monounsaturated fatty acids (y-axis), which exhibited a positive correlation. (b) Negative correlation between physical activity and Lachnospiraceae. The table (left) shows the top 10 negatively correlated parameters. The scatter plot (right) shows the relationship between Lachnospiraceae (x-axis) and time spent in moderate-intensity physical activity (y-axis), which showed a negative correlation. (c) Positive correlation between polyunsaturated fatty acids (PUFA) and Ruminococcaceae. The table (left) shows the top 10 positively correlated parameters. The scatter plot (right) shows the relationship between Ruminococcaceae (x-axis) and C18:3 ω-6 polyunsaturated fatty acids (y-axis), which showed a positive correlation. (d) Negative correlation between carbohydrates (e.g. boiled rice) and Ruminococcaceae. The table (left) shows the top 10 negatively correlated parameters. The scatter plot (right) shows the relationship between Ruminococcaceae (x-axis) and ‘Boiled rice’ (y-axis), which exhibited a negative correlation.

