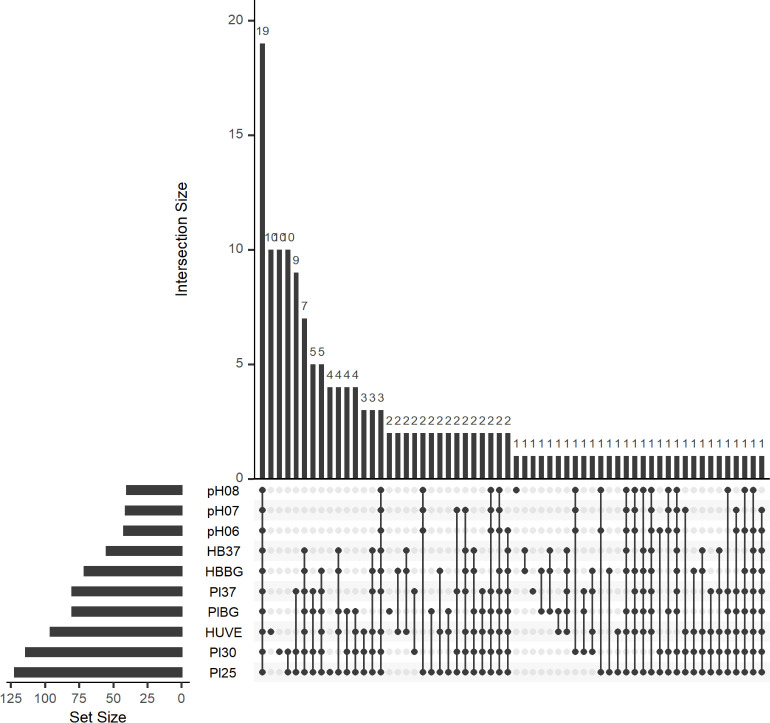
Fig 1. Most B. bacilliformis sRNAs are expressed under specific conditions.
An UpSet plot is shown and displays the number of sRNAs shared among various combinations of conditions tested. The bar graph to the left indicates the quantity of sRNAs with a TPM >300 under the conditions shown. The connected nodes indicate shared conditions giving rise to the number of sRNAs expressed as indicated by the bar graph at the top.

