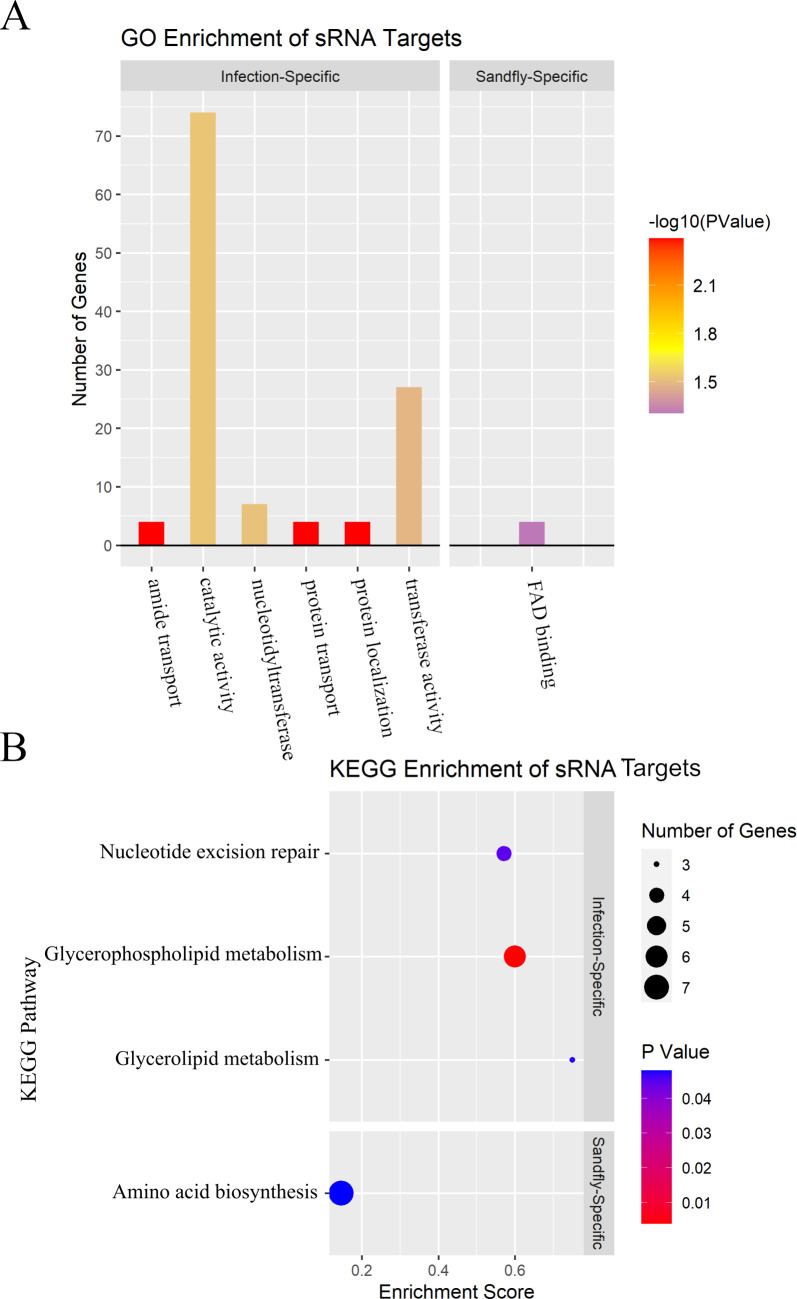
Fig 3. Condition-specific sRNA targets are enriched in several GO terms and KEGG pathways.
A) Faceted bar graph of GO enrichment terms for infection-specific and sand fly-specific sRNA targets. Height of the bars indicates the number of sRNA targets containing that GO term, while the color displays the significance of enrichment. B) Faceted dot plot of KEGG enrichment terms for infection-specific and sand fly-specific sRNA targets. The enrichment score refers to the ratio of the number of gene targets corresponding to a particular pathway to the total number of genes in that pathway. Dot colors represent significance (p-value) of enrichment for that particular KEGG pathway.

