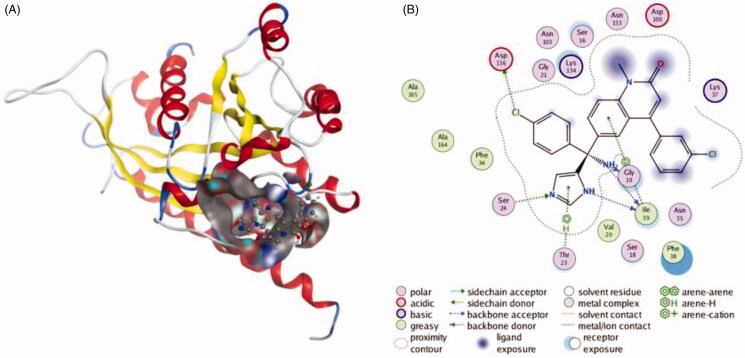
Figure 1.
The interactions between Tipifarnib and RAB27A from molecular docking. (A) The pocket is shown in electrostatics representation. (B) The two-dimensional schematic representation of the Rab27a and Tipifarnib complex interactions. Red, yellow, blue and white ribbons: RAB27A. The binding surfaces are identified in grey. The molecular structures of Tipifarnib is displayed by purple ball-and-stick models. Green lines indicate pi-pi stacking interactions, and purple dashed arrows represent sidechain hydrogen bond interactions. Polar and hydrophobic residues are depicted with green and pink circles, respectively.

