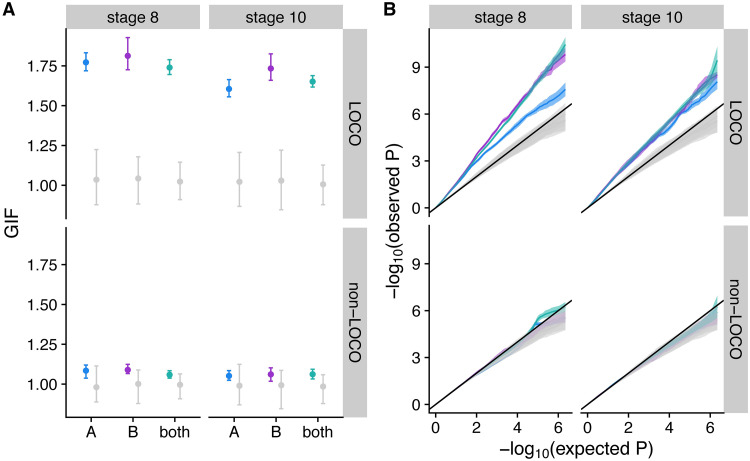
Fig 3. A leave-one-chromosome-out (LOCO) genetic relatedness matrix results in inflated P-values in actual but not permuted GWAS.
(A) Genomic inflation factor (GIF or λGC) for 100 imputations of actual data and 100–1000 permutations for LOCO (top) and non-LOCO (bottom) GWAS of two diapause phenotypes. Points represent the median and bars extend to the 2.5 an 97.5% quantiles. Grey bars show permutations for each mapping population. (B) Average quantile-quantile plots (blue = A, purple = B, teal = both, grey = permutations) for each GWAS. Observed P-values were averaged for each expected P -value across all imputation/permuations. Ribbons represent standard deviation; black lines have slope of 1.

