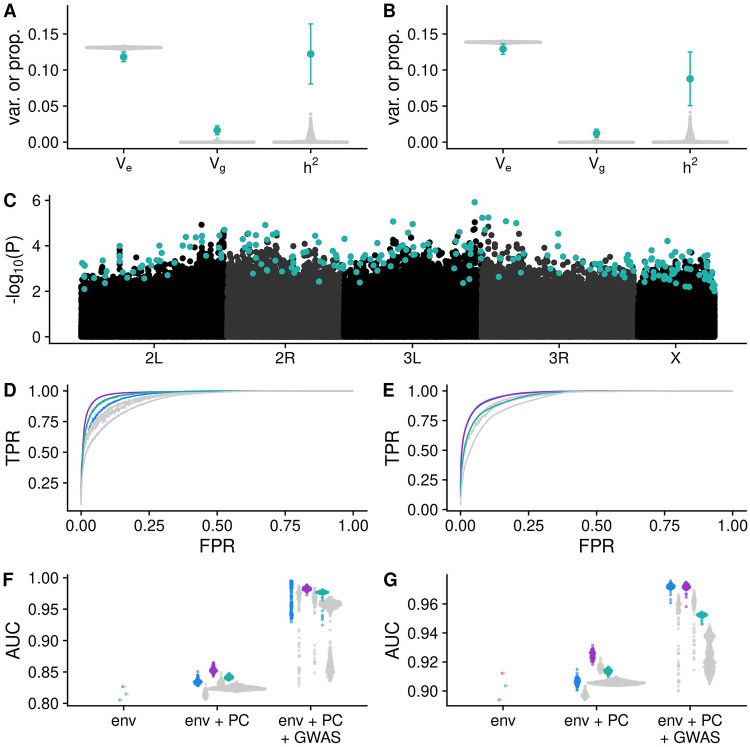
Fig 4. Diapause is a polygenic trait.
(A-B) Vg, Ve and heritabiilty estimates for stage 8 (A) and stage 10 (B) diapause phenotypes. Teal points indicate observed estimates +/- 95% confidence interval for heritability in the hybrid swarm (populations A and B combined). Grey points indicate heritability estimates for 1000 permutations. (C) Manhattan plot for GENESIS P-values for stage 10 diapause in one imputation. Teal points indicate LASSO SNPs. (D-E) Average receiver operating characteristic (ROC) curves for stage 8 (D) and stage 10 (E) diapause predictions made using LASSO SNPs (blue = A, purple = B, teal = both, grey = permutations). Phenotypes for each individual in the mapping population were predicted using the informative environmental variables, genetic principal components, and SNPs chosen by LASSO. At any given false positive rate (FPR), the true positive rate was averaged across all imputations or permutations. Observed data (colored lines) have higher true positive rates (TPR) relative to permutated GWAS (gray lines). (F-G) Quantification of ROC analysis using area under the curve metric (AUC) for stage 8 (F) and stage 10 (G) phenotypes. “env” is a model containing only environmental data; “env + PC” includes environmental data and 32 principal components; “env + PC + GWAS” includes the former plus the genotypes of up to several hundred SNPs chosen by LASSO.

