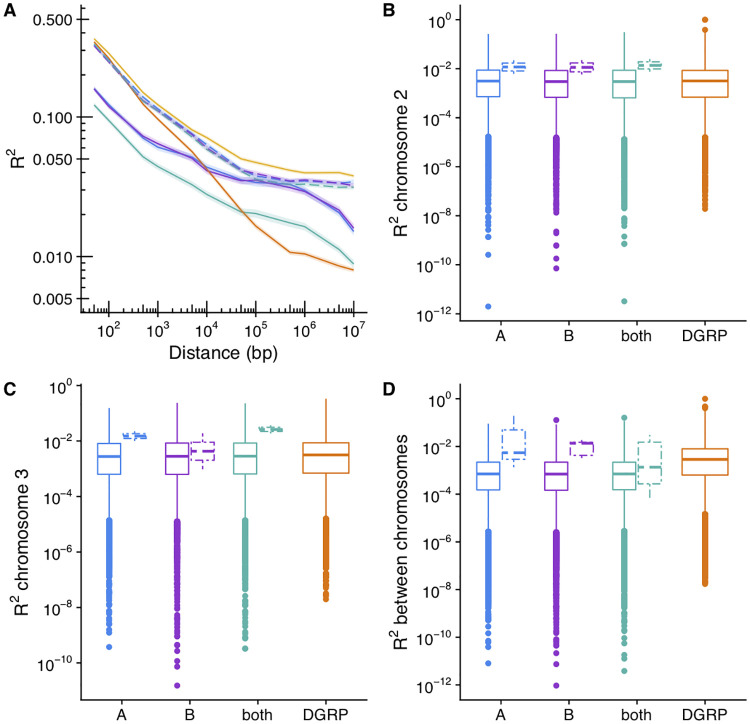
Fig 5. Analysis of linkage disequilibrium supports a polygenic basis of diapause.
(A): Linkage disequilibrium (LD) decay for SNPs with minor allele frequency > 0.05 in the hybrid swarm (blue = A, purple = B, teal = both) contrasted to the DGRP (orange) and the DGRP down-sampled to 34 lines (yellow). Dashed lines indicate parents of the hybrid swarms, while solid lines indicate the hybrid offspring. 10,000 SNPs were randomly sampled and LD (R2) to nearby SNPs at fixed distances was measured. Lines represent median LD; ribbons represent the 95% confidence intervals. (B-D) Long distance LD between pairs of SNPs randomly sampled from 2L and 2R (B), 3L and 3R (C), or sampled from different chromosomes (D). Dashed box plots indicate parental lines.

