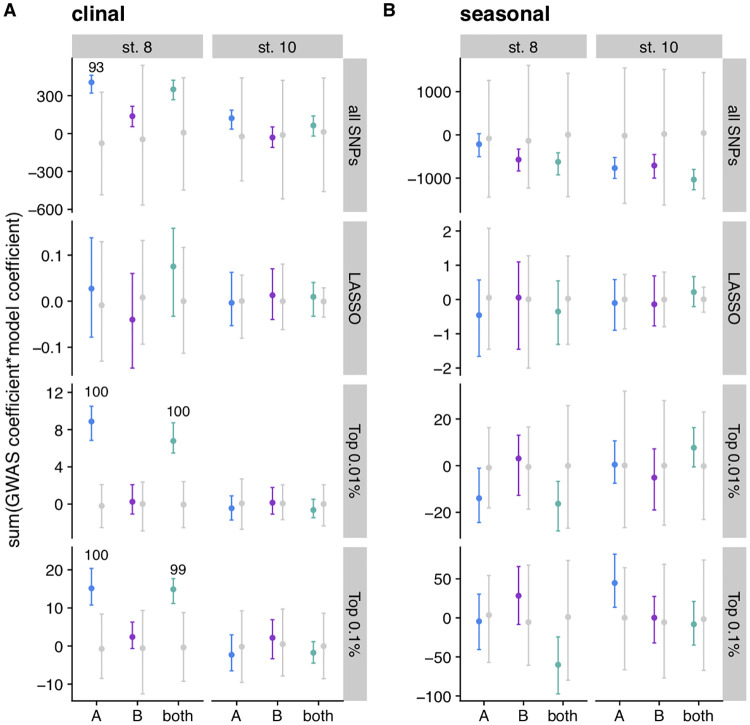
Fig 6. SNPs associated with diapause at stage 8 vary predictably across latitudinal clines.
(A) Polygenic scores calculated by multiplying clinal effect size reported in Bergland et al (2014) and GWAS effect size for each SNP and summing across all SNPs, LASSO SNPs, and the top 0.01% or 0.1% of the SNPs in the GWAS. Effect sizes are polarized such that positive numbers indicated pro-diapause alleles are more common in the north. (B) Polygenic scores calculated for seasonal data by multiplying seasonal effect size reported in Bergland et al (2014) and GWAS effect size, polarized so that pro-diapause alleles and alleles with higher frequency in spring are positive. Data are shown with a point for the mean and error bars extending to the 2.5% and 97.5% quantiles. Colored points indicate actual data for 100 imputations of each mapping population; grey points indicate the distribution for permutations. Numbers indicate the percentage of imputations that exceed the 97.5% quantile of the permutations, if greater than 50%.

