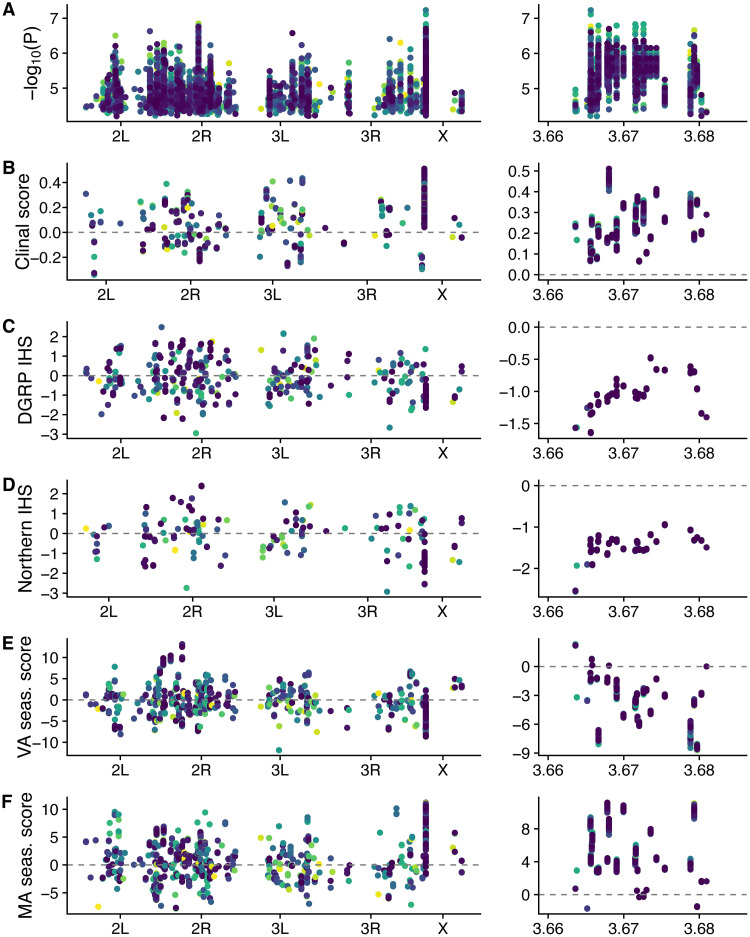
Fig 10. A small region near tlk on the X chromosome drives population genetic signal in the top 0.01% of SNPs.
The top 0.01% of SNPs for the combined mapping population for stage 8 diapause are color coded by their imputation number. Left panels show the full genome; right panel is focused on a region within the gene tlk (ChrX:3,660,000–3,685,000). (A) Manhattan plot. (B) Clinal polygenic scores using data from Bergland et al 2014. (C-D) IHS in the DGRP and Northern populations. (E) Seasonal polygenic scores from Charlottesville, VA in 2014. (F) Seasonal polygenic score from Lancaster, MA in 2014. Note that y-axis scales vary between left and right panels.

