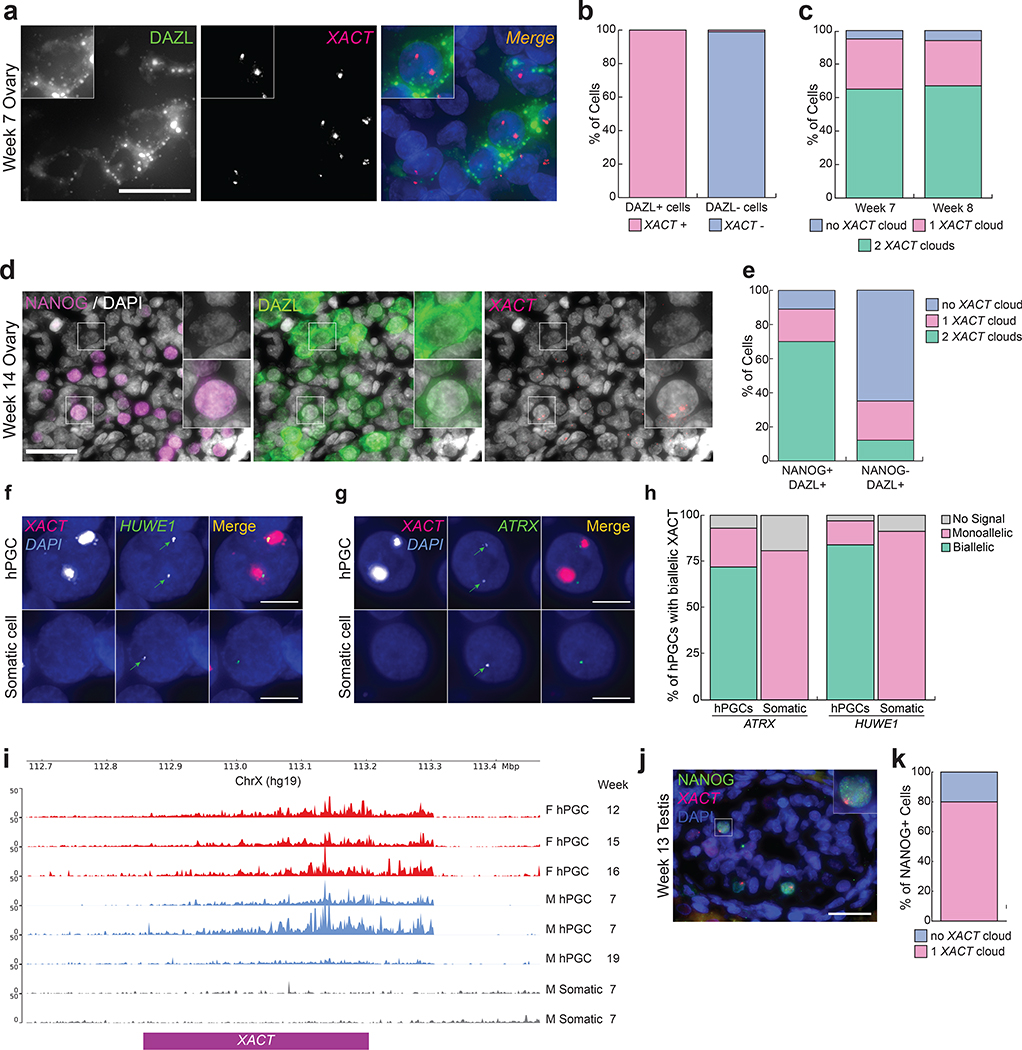
Fig. 1. Male and female hPGCs express lncRNA XACT and female hPGCs carry two active X chromosomes in vivo.
a. Immuno-RNA FISH for DAZL (green) and XACT (red) in a week 7 pf embryonic ovary (1 pair of ovaries were analyzed) with DAPI staining (blue) to detect nuclei, scale bar 30 microns. b. Quantification of cells with XACT clouds based on the experiment in (a) (n=100 cells). c. Quantification of the number of XACT clouds in DAZL+ hPGCs at week 7 and 8 pf (n=100 cells/timepoint). d. Immuno-RNA FISH for XACT (red), NANOG (magenta), DAZL (green) and DAPI (grey) in a week 14 pf fetal ovary (1 pair of ovaries were analyzed). Top inset shows a NANOG-/DAZL+ hPGC negative for XACT, lower inset a NANOG+/DAZL+ hPGC with two XACT clouds; scale bar 30 microns. e. Quantification of the proportion of cells with a different XACT cloud patterns in hPGCs (NANOG+/DAZL+) and differentiating hPGCs (NANOG-/DAZL+) from (d). 92 and 95 cells, respectively, were assessed. f-g. Representative RNA FISH images for detection of nascent transcripts of the X-linked genes HUWE1 and ATRX, respectively, both normally subject to XCI, in a week 8 pf ovary. hPGCs are marked by XACT expression. The experiments have been performed twice with similar results. h. Signal quantification for (g); n=60 and n=70 cells for ATRX and HUWE1, respectively. i. Published bulk RNA-seq read mapped to the XACT genomic locus in female hPGCs (red, isolated using cKITbright or using INTa6/EpCAM), male hPGCs (blue, enriched for TNAP/KIT expression) and gonadal somatic cells (grey)25,52,53. j. Immuno-RNA FISH in fetal male testis at week 13 pf (1 pair of testis were analyzed) with XACT (red), NANOG (green) and DAPI (blue), scale bar 30 microns. k. Quantification of the proportion of cells with one XACT cloud in NANOG+ male hPGCs from (j) (n=75 cells). Statistical source data are provided in Source data fig. 1.

