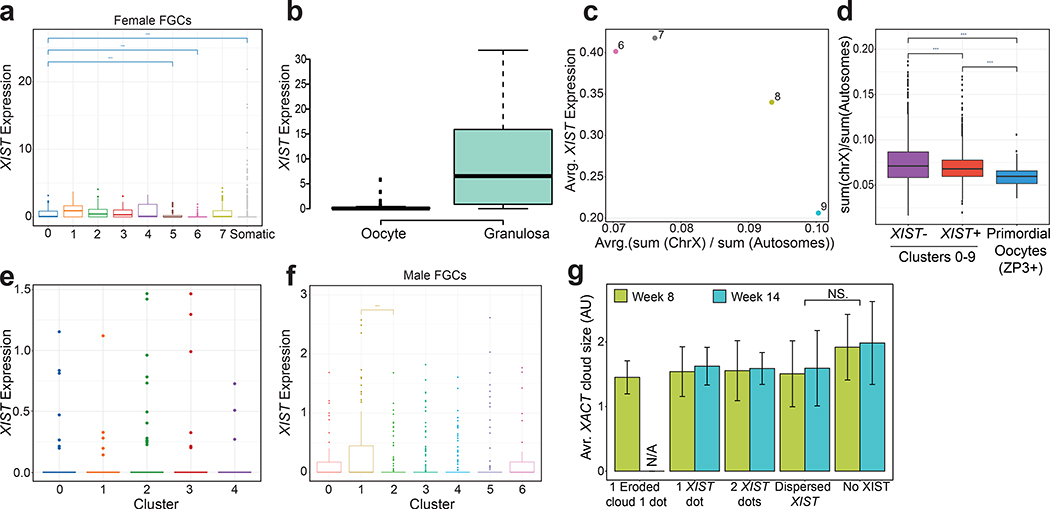
Extended Data Fig. 5. XIST expression correlates with the X/A ratio.
a. Boxplot depicting the expression of XIST in female germ cells organized by clusters along the developmental trajectory defined for the published FCG data set40 in Extended Data Fig. 3f,g. XIST expression is significantly reduced from cluster 5 onwards. b. XIST expression in mature oocytes and granulosa cells from scRNA-seq data of adult ovary44. c. Scatter plot of average XIST expression (y-axis) and average X/A ratio (x-axis) for female germ cells clusters 6–9 (from Figure 4d), capturing the entrance into meiosis. d. X/A ratios in female hPGCs and meiotic germ cells clustered based on expression of lncRNA XIST, ZP3+ primordial oocytes are clustered separately. e. Boxplots depicting XIST expression in male germ cells ordered along the developmental trajectory defined in Extended Data Fig. 4a–h, indicating that XIST transcripts are rarely detected in male germ cells. f. As in (e), except for male FGCs40 from Extended Data Fig 4i,j. g. Average XACT cloud size in week 8 and 14 pf hPGCs with different patterns of XIST expression, error bars show standard deviation of the cloud sizes (76 cells analyzed in total from 2 independent experiments). Wilcoxon statistical testing used for (a), (d), (f), (g). NS- Not Significant, * p<0.05, ** p<0.01, *** p<0.001. Number of cells analyzed across 5 independent experiments: a. n = 1016 cells40, b. n = 148 cells44, d. n = 1938 cells, f. n = 779 cells40.

