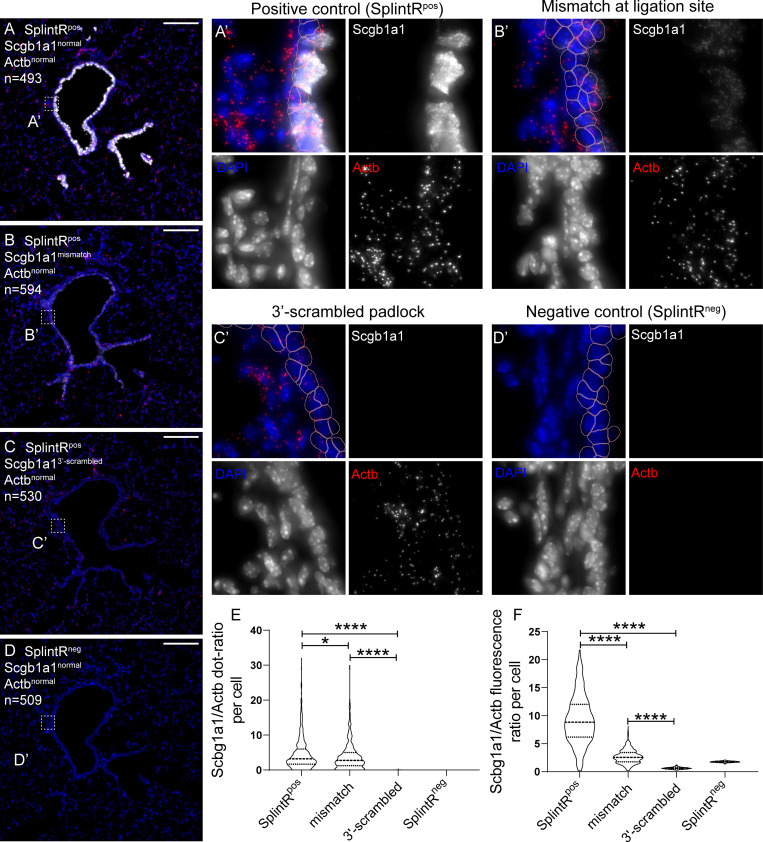
Fig 2. SCRINSHOT specificity relies on stringent hybridization of padlock probes to their target RNAs.
Images of SCRINSHOT signal, using normal Scgb1a1 padlock probe (A), a Scgb1a1 padlock probe with a point mutation at its ligation site (B), a Scgb1a1 padlock probe with 3′-scrambled arm (C) and normal padlock probe but omitting SplintR ligase (D). Actb normal padlock probe was used in all conditions as internal control. DAPI: blue, Scgb1a1: gray, Actb: red. “n” indicates the number of airway cells in the corresponding images. (A’-D’) Magnified areas of the indicated positions (square brackets) of images in the left. Pink outlines show the 2-μm expanded airway nuclear ROIs, which are considered as cells. Scale bar: 150 μm. (E) Violin plot of the Scgb1a1 and Actb signal dots ratio in all airway cells. The ratio of cells with zero Actb-dots was considered as zero. There were no statistically significant differences for Actb signal dots, between the analyzed conditions, except for the SplinRneg, that gave no signal, as expected, indicating that ligation is obligatory for signal detection (P values for Actb dot comparisons: "SplintRpos versus mismatch" = 0.7706, “SplintRpos versus scrambled" = 0.8837, "SplintRpos versus SplintRneg" ≤ 0.0001, "mismatch versus scrambled" = 0.6523, "mismatch versus SplintRneg" ≤ 0.0001, "scrambled versus SplintRneg" ≤ 0.0001). (F) Violin plot of the Scgb1a1 and Actb fluorescence intensity ratio in all airway cells. SplintRpos n = 473, mismatch n = 574, 3´-scrambled n = 507 and SplintRneg n = 488. The data underlying this Figure can be found in 10.5281/zenodo.3634561. ROI, region of interest.

