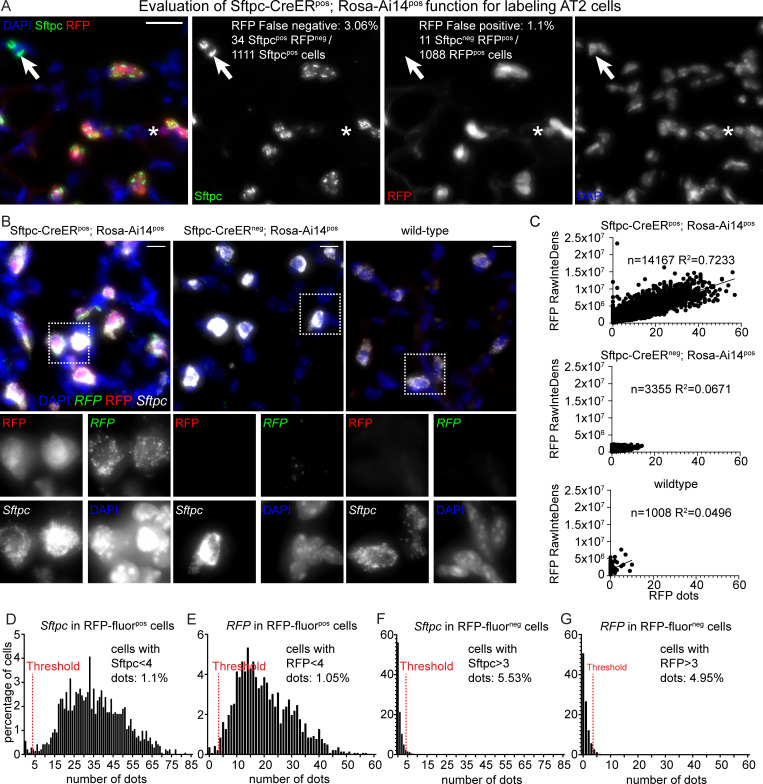
Fig 4. SCRINSHOT efficiently detects RFP and Sftpc mRNAs, upon Sftpc-CreER driven recombination in Sftpc-CreERpos;Rosa-Ai14pos lung cells.
(A) Evaluation of recombination efficiency, in the SCRINSHOT-analyzed, P21 Sftpc-CreERpos;Rosa-Ai14pos lung, after one Tamoxifen induction, on P1. Sftpc protein was detected in AT2 cells with antibody staining and Ai14 (RFP), based on its protein fluorescence. Arrow indicates an Sftpcpos RFPneg AT2 cell and the asterisk, an Sftpcneg RFPpos cell. DAPI: blue, Sftpc-antibody: green, RFP transgene: red. Scale bar: 20 μm. The data underlying this Figure section can be found in 10.5281/zenodo.3978632. (B) Representative images of alveolar regions from P21 Sftpc-CreERpos;Rosa-Ai14pos, P21 Sftpc-CreERneg;Rosa-Ai14pos, and P60 wild-type (Sftpc-CreERneg;Rosa-Ai14neg) lung sections. DAPI: blue, RFP mRNA detected with SCRINSHOT: green, RFP protein fluorescence: red and Sftpc mRNA detected with SCRINSHOT: white. Square brackets indicate the cropped areas of the bottom part of the panel. Scale bar: 10 μm. (C) Linear regression analyses of RFP protein fluorescence (RAW integrated density) and RFP SCRINSHOT dots, in the 3 analyzed lung sections, using GraphPad Prism. The “n” indicates the number of total cells in the analyzed images and “R2” shows the correlation coefficients. (D-G) Histograms of SCRINSHOT results for Sftpc and RFP in RFP protein fluorescence positive and negative cells. The y-axis shows the percentage of positive cells and x-axis the bins of the detected RNA transcripts number per cell. Threshold was set to 3 dots and shown with red dotted lines. Percentages in “D” and “E” correspond to the cells below threshold (false negatives) and in “F” and “G” to the cells above threshold (false positives) in RFP protein fluorescence positive and negative cells, respectively. The data underlying these Figure sections can be found in 10.5281/zenodo.3634561 and 10.5281/zenodo.3978632. AT2, alveolar type 2; P21, postnatal day 21; RawInteDens, raw integrated density; RFP, red fluorescent protein.

