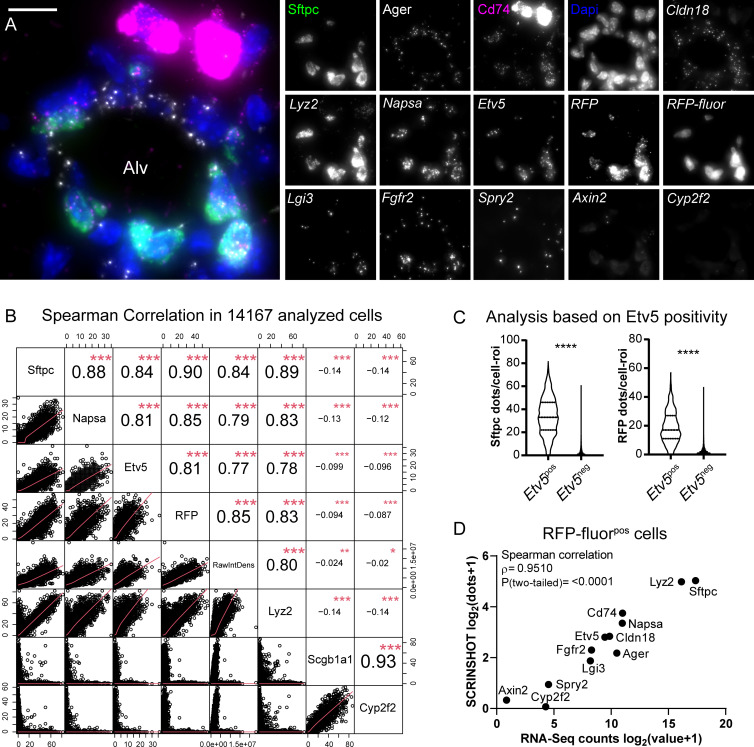
Fig 5. SCRINSHOT multiplex detection for AT2 selective genes indicates quantitative performance and high correlation with the GSE118891 scRNA-Seq dataset [36].
(A) Representative image of an Alv region, showing the SCRINSHOT dots of 13 genes in addition to RFP transgene, RFP protein fluorescence, and the club cell marker Cyp2f2 (negative control). Merge image includes Sftpc (green), Cd74 (magenta), Ager (gray), and DAPI (blue). The rest are indicated with italics, and only single-channel images are shown. Scale bar: 10 μm. The data underlying this Figure section can be found in 10.5281/zenodo.3634561. (B) Spearman correlation analysis, in all analyzed cells (14,167) of the Sftpc-CreERpos;Rosa-Ai14pos lung section, for the highly selective AT2 markers, Sftpc, Napsa, Etv5, and Lyz2. RFP SCRINSHOT-detected RNA transcripts and RFP protein fluorescence (raw integrated density) were also included to the correlation, as AT2 markers. Scgb1a1 and Cyp2f2 club cell markers were used as negative controls, anticorrelating with all other markers (negative coefficient values, ρ). (C) Violin plots of Sftpc (left) and RFP (right) SCRINSHOT dots, in Etv5pos (>3 dots) and Etv5neg (0–3 dots) alveolar cells. Etv5pos n = 1,431 cells and Etv5neg n = 12,736 cells. (D) Correlation plot of the indicated genes, between the average log2(raw counts+1) values of 156 AT2 cells of GSE118891 and SCRINSHOT signal dots of 1,425 RFP fluorescence positive cells. The data underlying these Figure sections can be found in 10.5281/zenodo.3978632. Alv, alveolar; AT2, alveolar type 2; RawIntDens, raw integrated density; RFP, red fluorescent protein.

