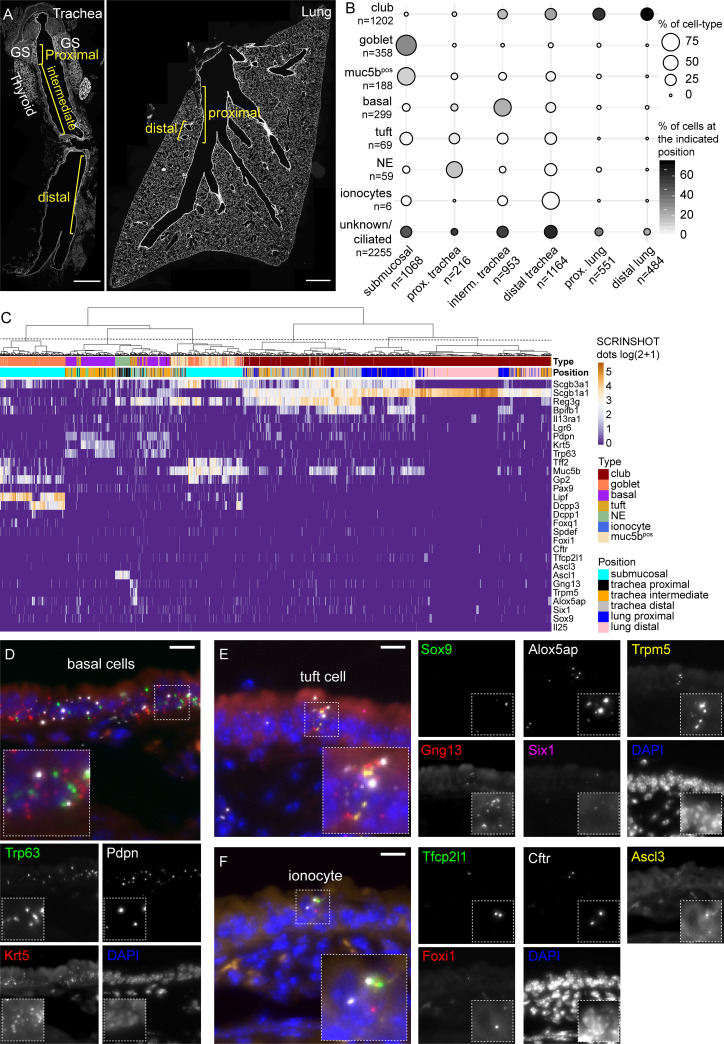
Fig 6. Spatial mapping of tracheal cell types with SCRINSHOT.
(A) Overview of analyzed trachea and lung tissue sections using nuclear staining. Analyzed areas are indicated by brackets, corresponding to proximal trachea, GS, intermediate, and distal trachea, followed by proximal and distal lung airways. Trachea image includes also thyroid glands. Scale bar: 500 μm. (B) Balloon plot of the annotated cell types, at the analyzed positions. The balloon size indicates the percentage of the cell-type at the indicated position relatively to the total number of cells of the cell-type. The balloon intensity corresponds to the percentage of the specified cell-type, relative of the total number of cells at the indicated position. (C) Hierarchical clustering of the annotated cells. Heatmap shows the log2(dots/cell + 1) gene values in the analyzed cells. (D) Characteristic example of basal cells in tracheal epithelium. Trp63 (green), Ktr5 (red), Pdpn (gray), and DAPI (blue). Scale bar: 10 μm. (E) Detection of a tuft cell in tracheal epithelium. Sox9 (green), Gng13 (red), Alox5ap (gray), Trpm5 (yellow), Six1 (magenta), and DAPI (blue). Scale bar: 10 μm. (F) An ionocyte in trachea airway epithelium, detected with Tfcp2l1 (green), Foxi1 (red), Cftr (gray), Ascl3 (yellow), and DAPI (blue). Scale bar: 10 μm. The data underlying this Figure can be found in 10.5281/zenodo.3634561. GS, submucosal gland; RFP, red fluorescent protein.

