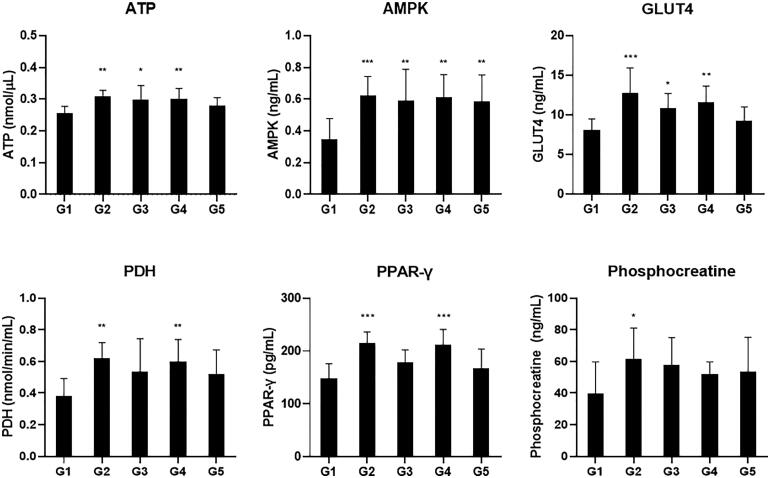
Figure 3.
ELISA analysis results of the energy production related biomarkers. Mice were fed with vehicle (G1), 100 mg/kg of red ginseng (G2), or 50, 150, and 300 mg/kg of CMEE (C3–C5) for 12 weeks. Data are expressed as mean ± S.D. (n = 10 mice in each group). ***p < 0.001, **p < 0.01, *p < 0.05, compared with normal control (G1).

