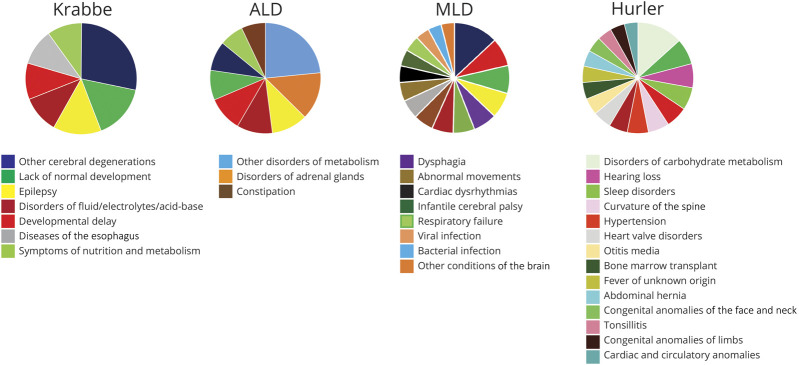
Figure 3. Conditions with RDs of 30% or more in the individual leukodystrophies, displayed by leukodystrophy in the order of increasing number of conditions (phecodes).
Values reported in tables e3-e6, links.lww.com/CPJ/A154, links.lww.com/CPJ/A155, links.lww.com/CPJ/A156, links.lww.com/CPJ/A157. All p values < 0.001. Phecodes are color-coded for all charts; phecode (and its color in the pie chart) is only listed the first time it is reported. RD = rate difference.

