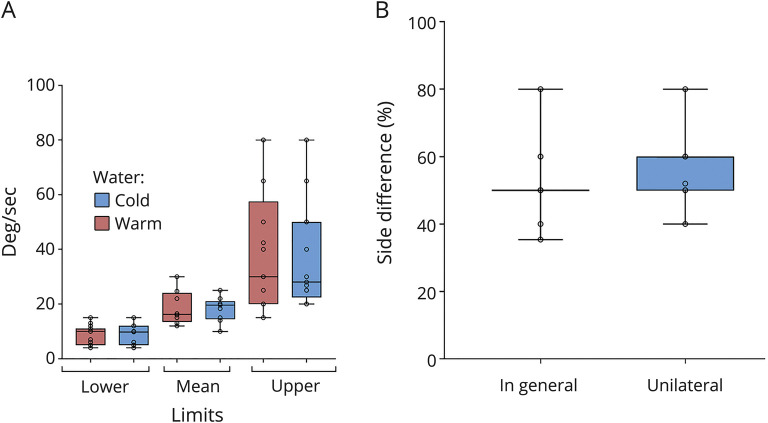
Figure 3. Caloric irrigation.
(A) Median, interquartile range (the middle 50% of the values), minimum, and maximum of reference values of the mean peak slow phase velocity for caloric irrigation. (B) Median, interquartile range (the middle 50% of the values), minimum, and maximum cutoffs for side difference in % for the diagnosis of unilateral vestibulopathy for caloric irrigation.

