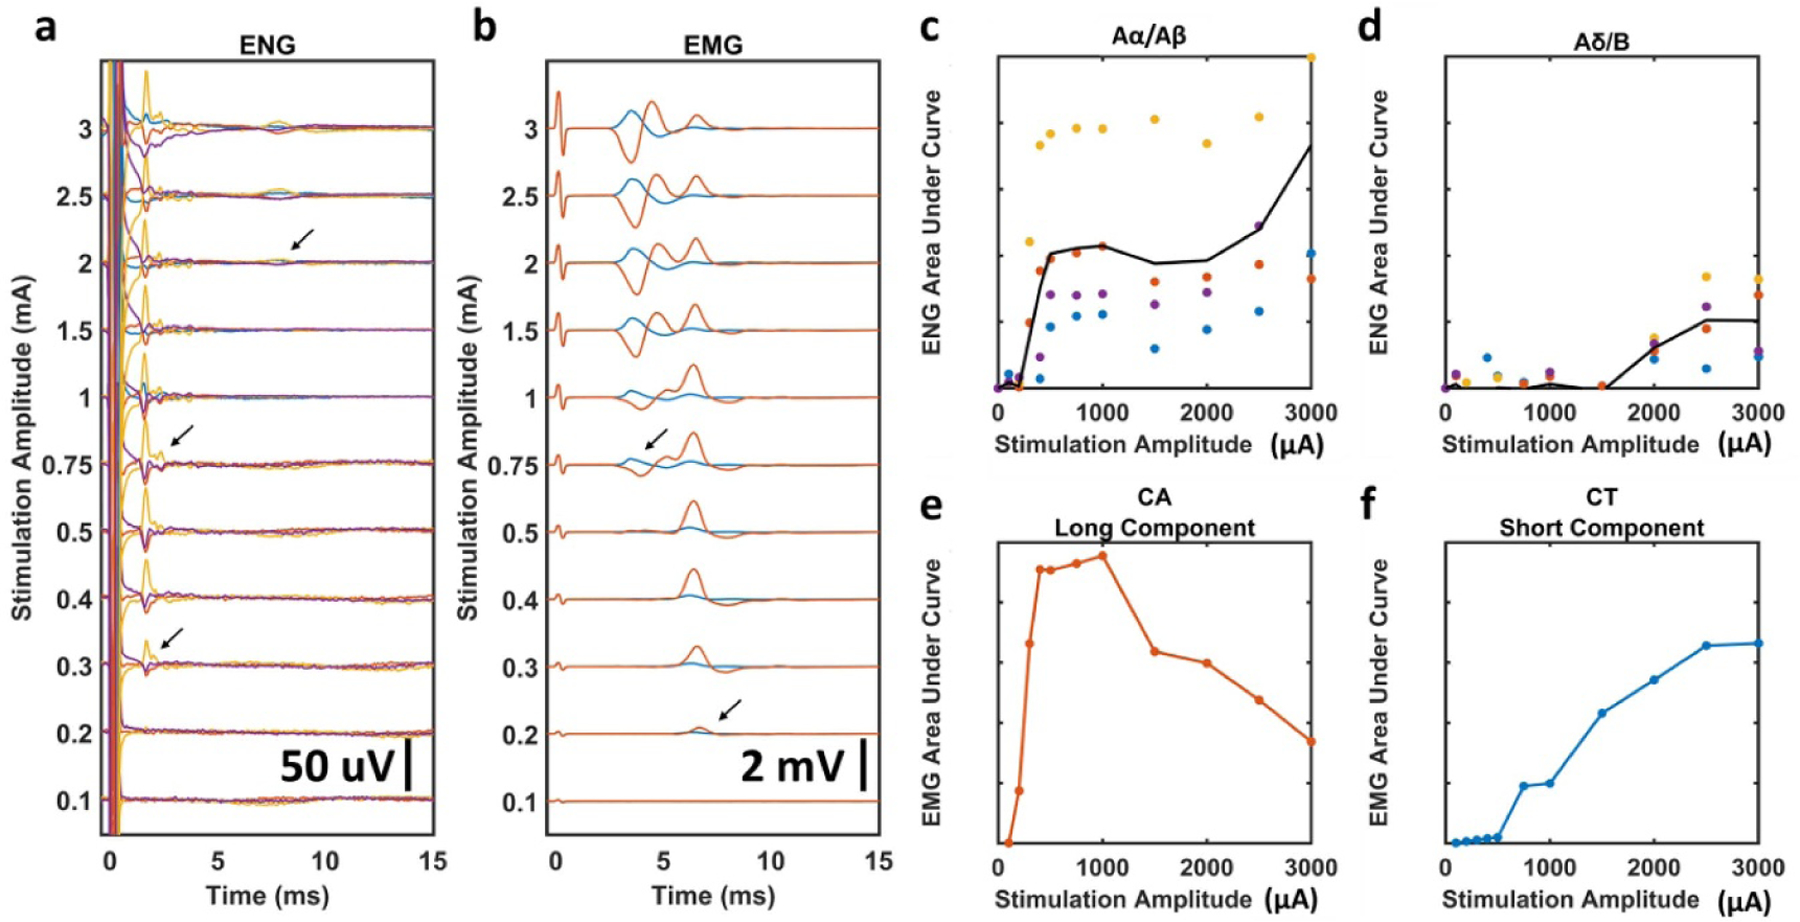
Figure 5.

Stimulation dose-response curves and determination of stimulation amplitude threshold for each fiber type in a representative animal. EMG recordings were taken before neuromuscular blockade, ENG recordings were taken in the same animal during neuromuscular blockade. All panels are analyses performed in a single animal, data for all animals can be found in the supplementary section. (a) All stimulation-triggered median ENGs for a representative animal. Arrows indicate visually identified thresholds for each ENG signal; Aα/Aβ, Aγ, and Aδ/B from bottom to top. Colored traces represent four different LIFEs. (b) All stimulation-triggered median EMGs for the same representative animal. Arrows indicate visually identified thresholds for each EMG signal; long-component and short-component from bottom to top. Colored traces represent the CA response (red) and CT response (blue). (c), (d) Dose-response curves for Aα/Aβ and Aδ/B ENGs calculated using historically available conduction velocities to determine latency ranges. Black line is average of all LIFEs. (e), (f) Dose-response curves for long-component CA and short-component CT EMGs calculated using visually identified latency ranges.
