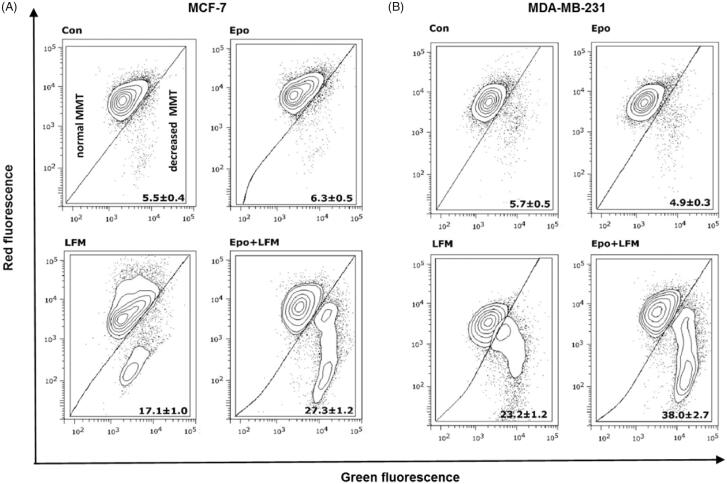
Figure 2.
Representative dot-plots presenting the loss of mitochondrial membrane potential (MMP) in MCF-7 (A), and MDA-MB-231 (B) cells incubated with Epo (Epo100, 100 IU/ml) and LFM-A13 (LFM100, 100 μM) for 48 h (mean ± SD; n = 3). Cells with normal MMT are shown on the left side of the plots, cells with decreased MMT on the right side of the plots.

