
Figure 1:
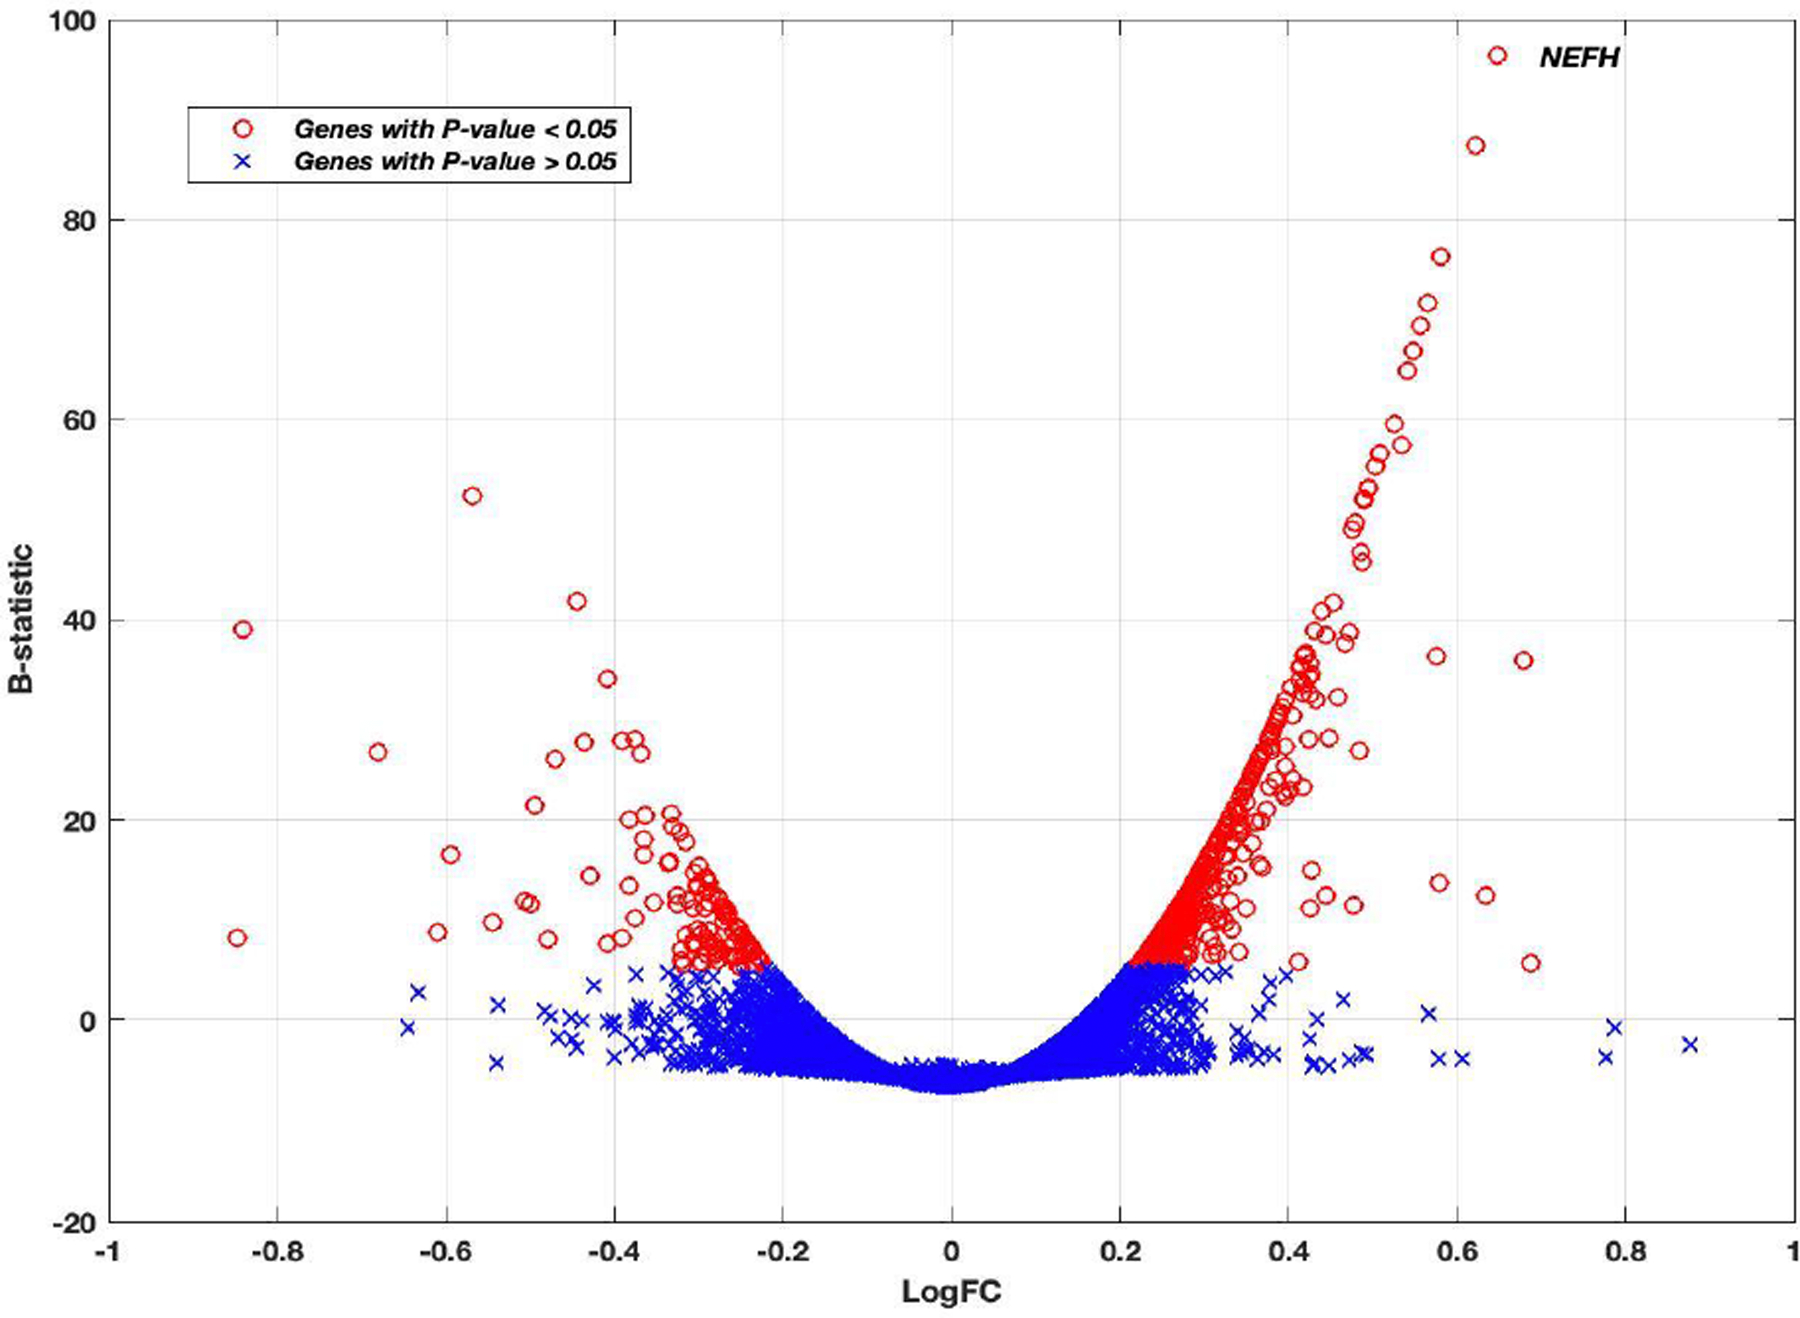
The Volcano plot of Log2 fold change versus B-statistic for all genes. Genes with P-value<.05 are shown as red circles. Otherwise, they are blue crosses. The NEFH gene is marked. The NEFH gene was the most statistically significant differentially expressed gene.