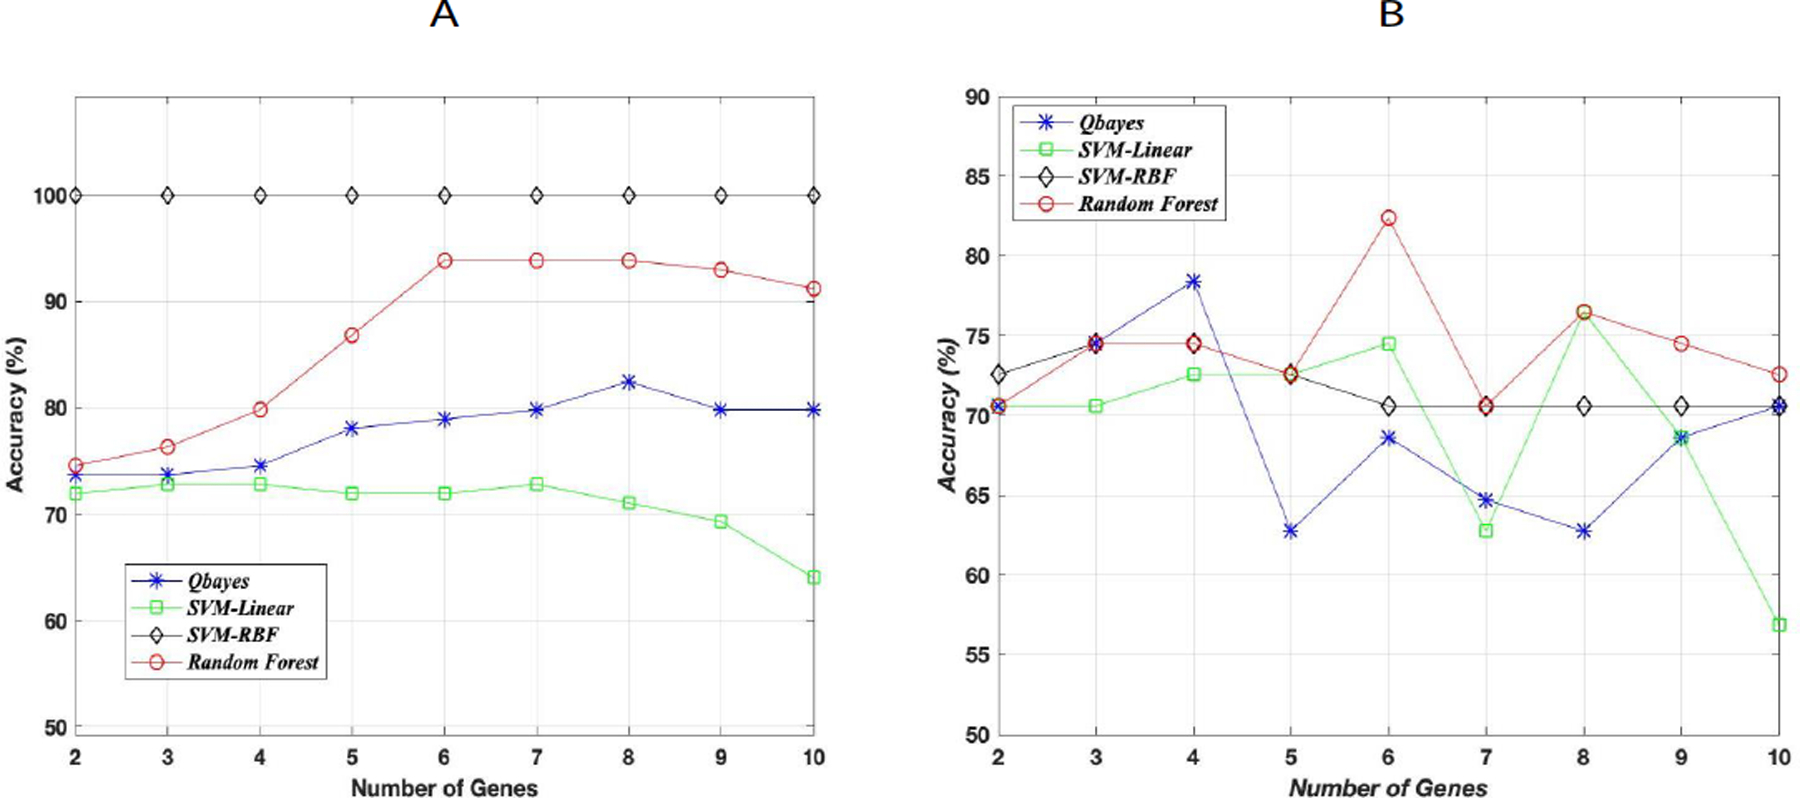
Figure 4:

Supervised ML classification using the top ten genes. (A) Classification results on the training data using four algorithms. The plots correspond to the maximum training accuracy achieved on a combination of N genes where 2 ≤ N ≤ 10. (B) Classification results on the testing data. The plots correspond to the testing accuracy on N genes that achieved the highest accuracy on the training data.
