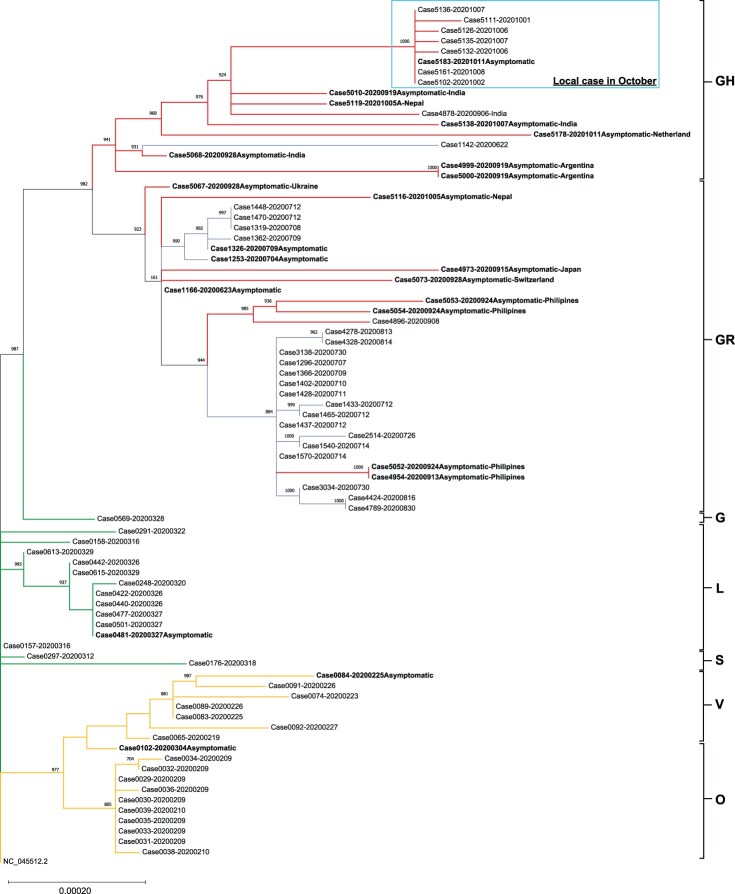
Figure 1.
Phylogenetic tree constructed by PhyML using maximum likelihood with bootstrap value set at 1000×. The tree was rooted on the earliest published genome (accession no.: NC_045512.2). Each genomic sequence consisted of 29,782 bp. A total of 360 variable sites were identified by multiple alignment and were used for phylogenetic tree construction. Specimens were labelled by the CHP case number followed by the diagnostic date (YYYYMMDD). Asymptomatic patients were bolded and imported cases were labelled by the departing countries. The letters on the right of the figure are the GISAID phylogenetic clades. Branch lengths were measured in number of substitutions per site. The bar with 0.00020 means that there are approximately 6 substitutions (0.0002 × 29,903 bp) difference when two strains were located at the opposite end of a bar of this length. Branches were highlighted as follow: Orange for cases from January to February (genomes generated in our previous work [1]); Green for cases from March to April; Blue for cases from July to August; and Red for recent cases in September to October (genomes generated in the present study). Locally acquired cases recorded in October were circled by Cyan box.

