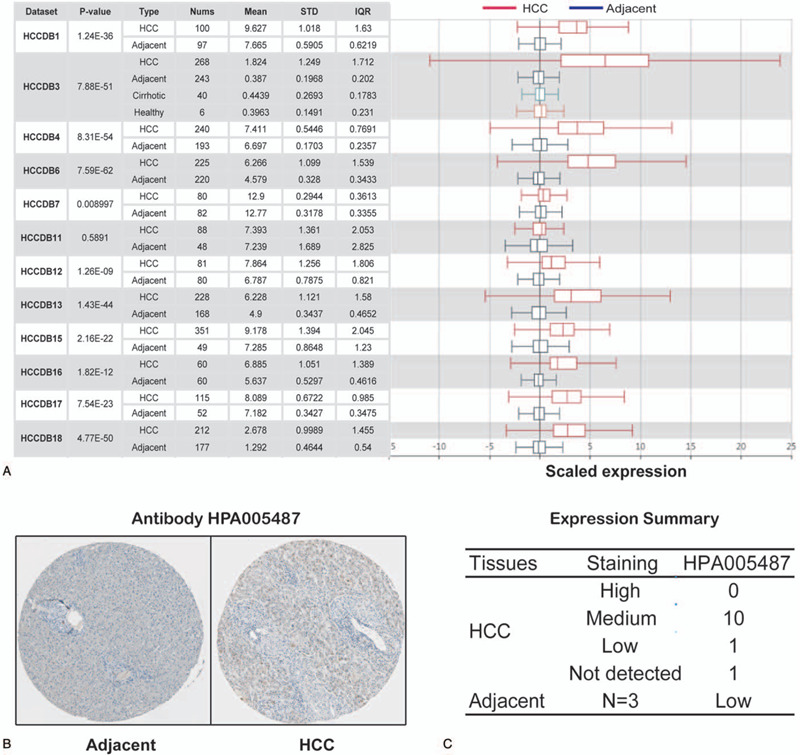
Figure 2.

TPX2 expression level in HCC. (A) Chart and box plot showing the expression of TPX2 in cancerous tissues and the adjacent normal tissues, according to t test in HCCDB. (B) The protein expression of TPX2 in HCC from HPA. (C) Distribution of TPX2 protein expression level in HCC in HPA.
