
Figure 3.
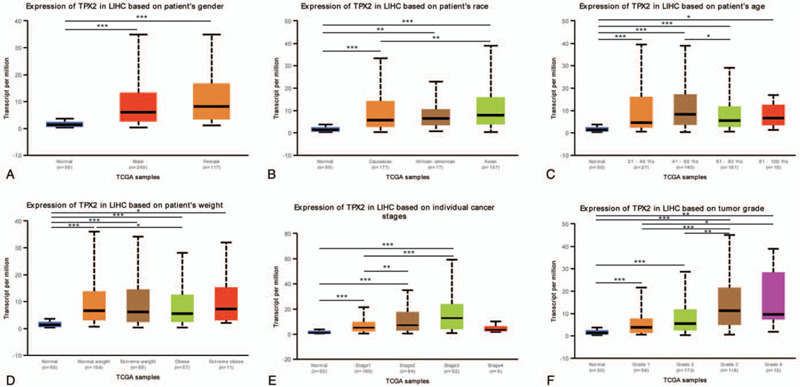
TPX2 transcriptional level in subgroups of patients with HCC. (A) Boxplot showing expression level of TPX2 in normal individuals of either gender and male or female HCC patients, respectively. (B) Boxplot showing expression level of TPX2 in normal, African American, Caucasian, and Asian HCC patients. (C) Boxplot showing expression level of TPX2 in normal individuals of any age or in HCC patients aged 21-40, 41-60, 61-80, or 81–100 yr. (D) Boxplot showing expression level of TPX2 in normal individuals of any weight or in HCC patients with normal weight, extreme weight, obese or extreme obese. (E) Boxplot showing expression level of TPX2 in normal individuals or in HCC patients at stages 1, 2, 3, or 4. (F) Boxplot showing expression level of TPX2 in normal individuals or HCC patients with grade 1, 2, 3, or 4 tumors. ∗P < .05, †P < .01, ‡P < .001.