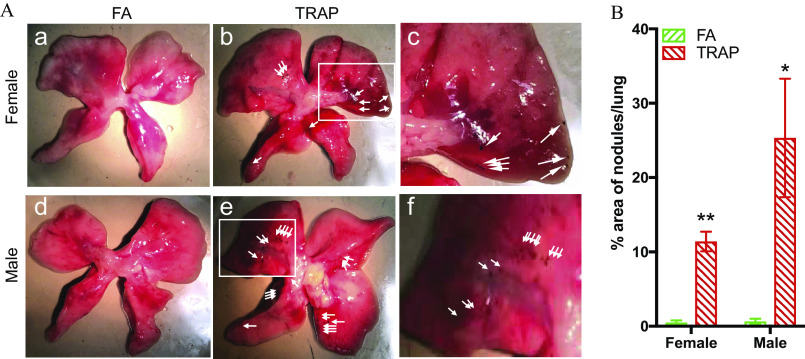
Figure 3.
Macroscopic view of black nodules in the lungs after chronic exposure. (A) Representative lung images of FA-exposed female rats (a), TRAP-exposed female rats (b), FA-exposed male rats (d), and TRAP-exposed male rats (e) were selected; (c) and (f) are enlarged images of the white rectangle in figure (b) and (e), respectively. White arrowheads show black nodules found on surface of lung tissues. (B) Statistical analysis was shown in the bar graph. Two-way analysis of variance (ANOVA) followed by Sidak’s multiple comparisons test was used for statistical analysis. ; The exact mean and SEM values for data presented here can be found in Table S6. Note: FA, filtered air; SEM, standard error of the mean; TRAP, traffic-related air pollution. * **.

