. 2020 Dec 4;128(12):127003. doi: 10.1289/EHP7045

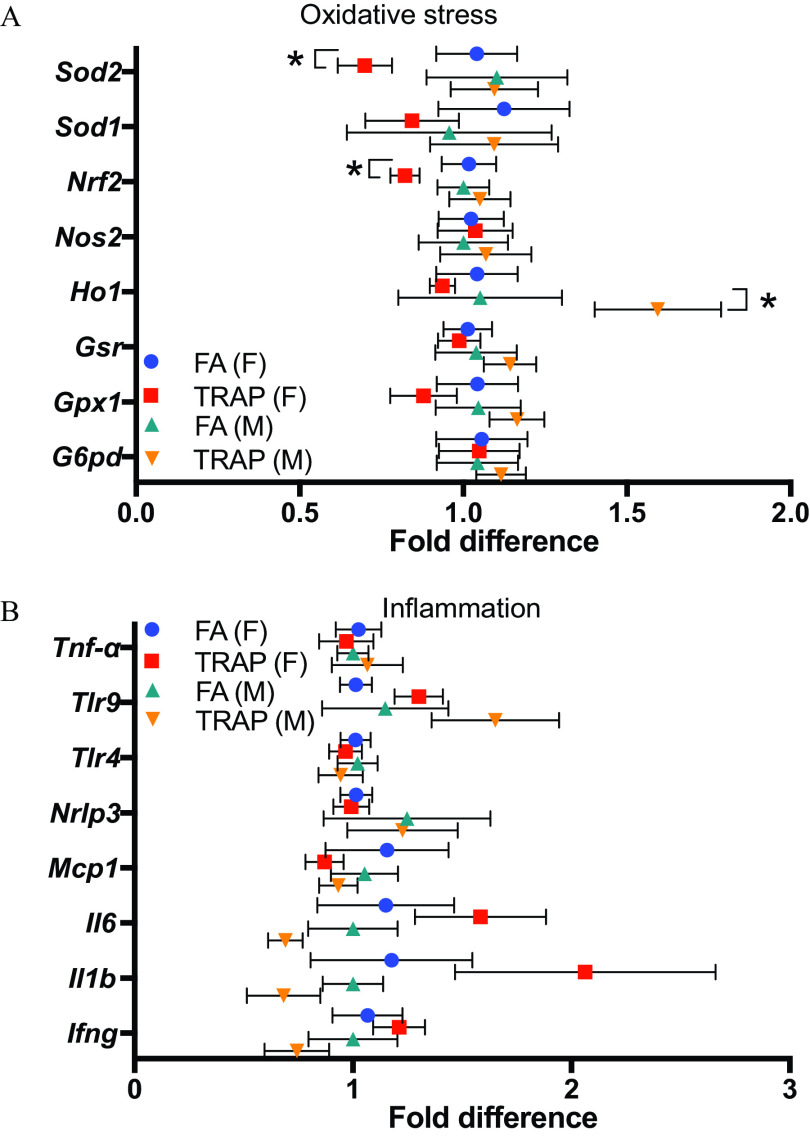
Figure 5.

Figures 5A and 5B are error bar graphs titled oxidative stress and inflammation plotting Superoxide dismutase 2, Superoxide dismutase 1, Nuclear factor erythroid 2-related factor 2, Nitric oxide synthase, Heme oxygenase, Glutathione-Disulfide Reductase, Glutathione peroxidase 1, and Glucose-6-phosphate dehydrogenase, and Tumour Necrosis Factor lowercase alpha, Toll-like receptor 9, Toll-like receptor 4, nucleotide-binding domain like receptor protein 3, monocyte chemoattractant protein-1, Interleukin 6, Interleukin 1 lowercase beta, and Interferon lowercase gamma (y-axis) across fold difference, ranging from 0.0 to 2.0 in increments of 0.5 and 0 to 3 in unit increments (x-axis) for filtered air (female), Traffic-related air pollution (female), filtered air (male), and Traffic-related air pollution (male), respectively.

Expression of oxidative stress and inflammation-related genes were examined in the lung tissues by qRT-PCR. (A) Fold difference of oxidative stress-related genes in lungs from both female and male rats exposed to FA or TRAP. (B) Fold difference of inflammatory genes in lungs from both female and male rats exposed to FA or TRAP. Fold differences in gene expression were calculated by delta delta CT (cycle threshold) method (2ΔΔCT). All gene expressions were normalized by expression of housekeeping gene beta-actin and FA group was used as a reference group when calculating the ΔΔCT values. The formulas are: ΔCT=CT (gene of interest)CT (beta-actin); ΔΔCT=ΔCT (TRAP)ΔCT (average of FA); Fold gene expression=2ΔΔCt. Two-way analysis of variance (ANOVA) followed by Sidak’s multiple comparisons test was used for statistical analysis. Mean±SEM; n=6 The exact mean and SEM values for data presented here can be found in Table S7. Note: FA, filtered air; SEM, standard error of the mean; TRAP, traffic-related air pollution. *p<0.05.