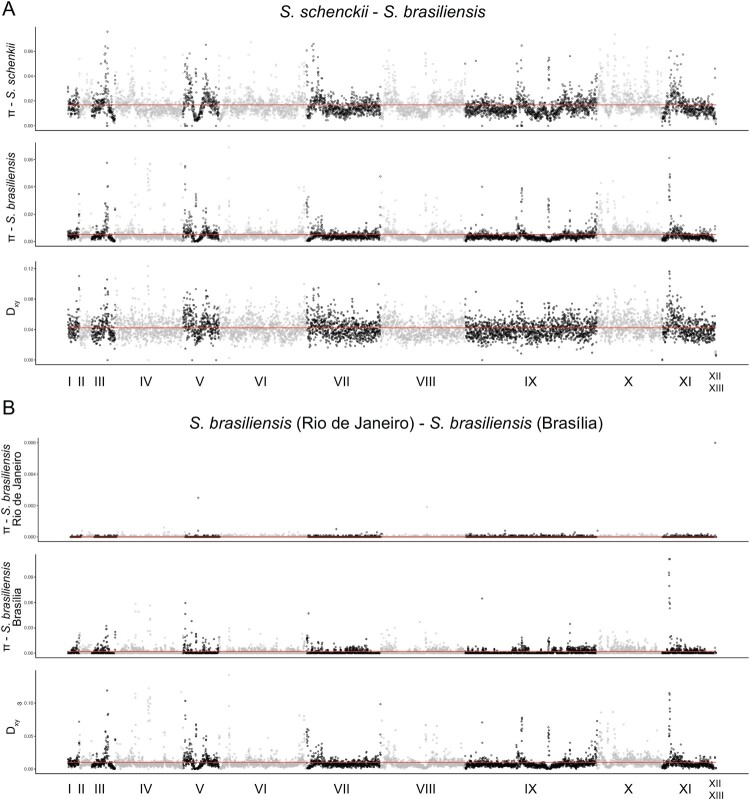
Figure 2.
Population genetics plots along the S. brasiliensis 5110 reference genome. We have calculated the mean nucleotide diversity (π) within species or populations and absolute differentiation (Dxy) between S. brasiliensis and S. schenckii, and between the S. brasiliensis SbFD and SbRJ (red line) and plotted along each scaffold of the S. brasiliensis 5110 genome using a 5 kb window.

