Figure 2.
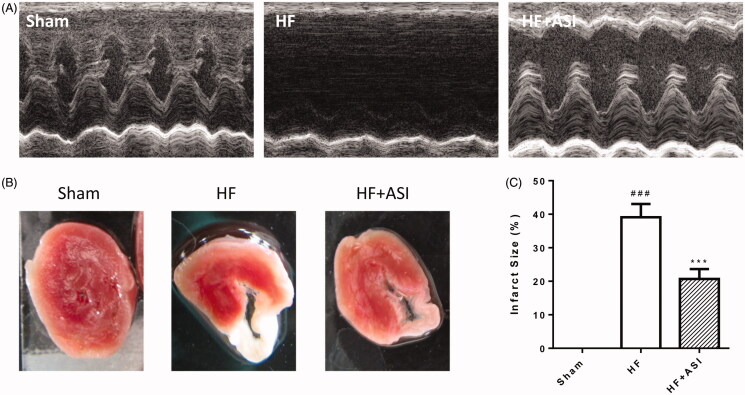
Cardiac function and infarct size of the hearts. Cardiac function of the rats was dynamically evaluated by echocardiography. Upon termination, the hearts were excised, and the infarct size of the hearts was determined by TTC staining. (A) Representative echocardiogram. (B) Representative photograph of infarct size. (C) Statistical analysis of infarct size. Data are presented as mean ± SD. n = 6. ###p < 0.001 vs. sham group. ***p < 0.001 vs. HF group.

