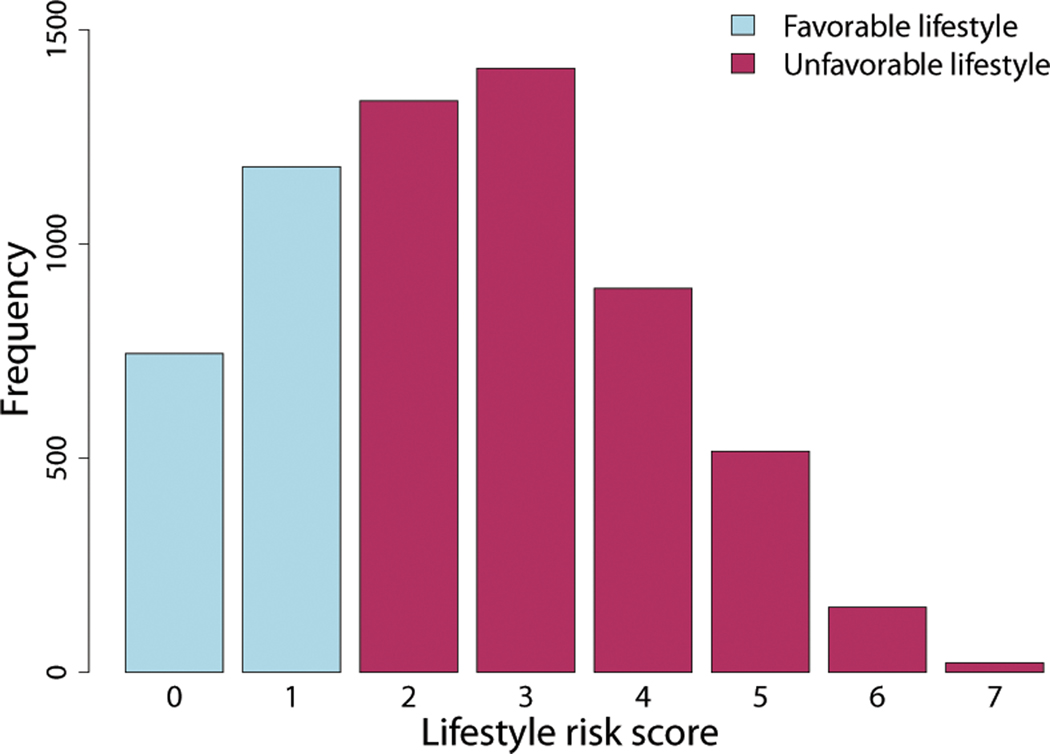
Figure 1.

Distribution of lifestyle risk score (LRS) in the FHS data. The quantitative LRS (QLRS), created by summing risks across the four lifestyle exposures, ranged between 0 and 7. The dichotomous LRS (DLRS), created by splitting QLRS by the median of its distribution, was composed of two groups: favorable lifestyle group (QLRS < 2) and unfavorable lifestyle group (QLRS ≥ 2).
