. 2020 Dec 4;9:e59055. doi: 10.7554/eLife.59055

Figure 1. Temperature dependence of complementation of E. coli LB2003 strain by various MthK constructs.

(A) Schematic outlining the three different MthK constructs used in this study. The first 107 amino acids, which include the short cytoplasmic N-terminus (residues 2–17) and the two transmembrane helices are highlighted in deep blue. The C-terminus cytoplasmic region containing the RCK domain is shown in red. (B) Panels showing complementation of LB2003 by MthK constructs at different temperatures. Each column represents log10 dilution as indicated below. The plates were incubated for 18 hr at 36°C, 24 hr at 28°C, 48 hr at 24°C, and 96 hr at 18°C in order to compensate for differences in growth rate (see Materials and methods) (C) Complementation of LB2003 by MthK constructs at 37°C and 24°C in mini suspension cultures. Error bars represent SEM from n = 4 (MthK FL, 37°C), 3 (MthK FL, 24°C), 4 (MthK IR, 37°C and 24°C), 3 (MthK ΔC 37°C and 24°C), 3 (empty vector, 37°C), and 5 (empty vector, 24°C) independent experiments. Significance was determined by Student's two-sample T-test (* for p<0.05; ** for p<0.01).

Figure 1—source data 1. Source data for Figure 1C and student's two sample t-test analysis.

Figure 1.

Figure 1—figure supplement 1. Complementation of LB2003 with MthK constructs at 37°C and 24°C.

Figure 1—figure supplement 1.

OD600 of overnight mini suspension cultures was measured for LB2003 transformed with MthK construct or empty vector at 37°C (A) and 24°C (B) and plotted as bar graphs. 5 mM BaCl2 was used as blocker in the control experiment. (C) Comparison of the blocker results at 37°C and 24°C. Error bars indicate the SEM at each condition (n = 4 for MthK FL 37°C with and without blocker; n = 3 for MthK FL 24°C, n = 4 for with blocker; n = 4 for MthK IR 37°C and 24°C, both with and without blocker; n = 3 for MthK ΔC 37°C with and without blocker; n = 3 for MthK ΔC 24°C, n = 4 with blocker; n = 3 for empty vector at 37°C both with and without blocker and n = 5 for empty vector at 24°C both with and without blocker). Significance was determined by Student's two-sample T-test (* for p<0.05; ** for p<0.01).
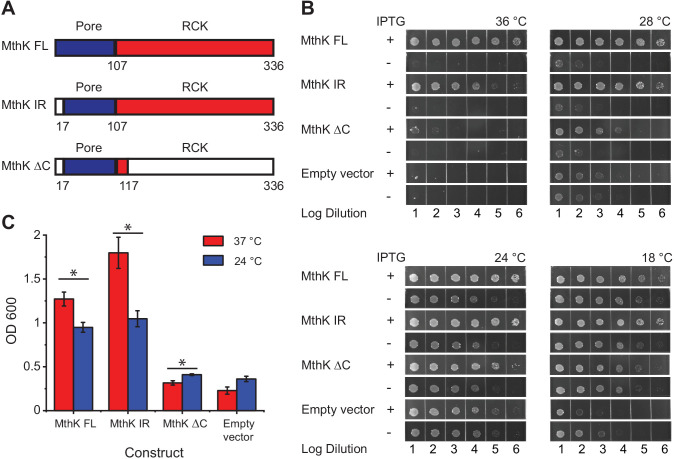
Figure 1—figure supplement 1—source data 1. OD600 bacterial density measurements and student's two sample t-test analysis.
Figure 1—figure supplement 2. MthK IR expressed in bacterial membranes shows increased activity at higher temperatures.

Figure 1—figure supplement 2.

(A) Representative inside-out patch clamp recordings of MthK IR in giant E. coli spheroplast with 1.5 mM calcium at various temperatures. All recordings in this panel were obtained from the same patch in 150 mM symmetrical potassium. (B) Representative macroscopic recordings of MthK IR in the presence of 0.3 mM barium. These recordings were obtained from the same patch as in A. (C) Representative macroscopic recordings of MthK IR channel in the presence of 20 mM calcium at various temperatures. (D) Normalized MthK IR currents plotted with respect to temperature. Baseline subtracted currents (red) were obtained by subtracting barium block currents (green) from total currents obtained in the presence of 1.5 mM calcium(black). Error bars are SEM from n = 4 independent measurements for 1.5 mM calcium and n = 3 independent measurements for 0.3 mM barium.
Figure 1—figure supplement 2—source data 1. Source data for Fig. 1-S2D normalized macroscopic currents.