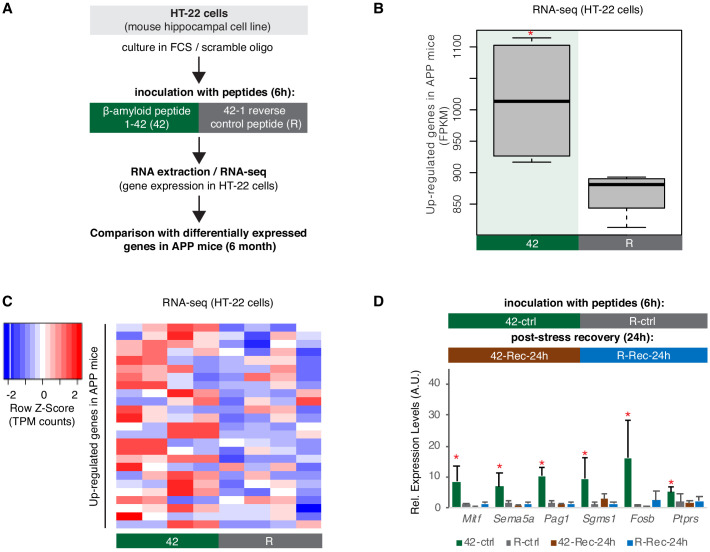
Figure 6. A hippocampal cell culture assay for tracking effects of amyloid beta toxicity on B2 RNA stability.
(A) Experimental design for the amyloid toxicity cell culture assay employing HT-22 cells. Cells culture media were supplemented with Fetal Calf Serum (FCS) and the scramble LNA described in Figure 8 to allow comparison with the LNA experiments. (B) Expression levels as defined by long-RNA-seq of genes upregulated in amyloid pathology (6-month-old APP mice) that are also upregulated in amyloid toxicity (25 genes, Supplementary file 1). Boxplot depicts distribution of expression levels (in FPKM/Fragments per Kilobase per Million) of these genes between the two conditions in HT-22 cells. p=0.05 for the comparison between HT22 samples transfected with 1–42 (Espinoza et al., 2007) vs 42–1 reverse control peptide (R) (depicted as asterisk, unpaired non-directional t-test, n = 4/group). (C) Heat map showing gene expression changes during incubation with amyloid peptides in HT22 cells for genes that are also upregulated in amyloid pathology (25 genes, Supplementary file 1) to test whether our cell culture system can simulate the transcriptome observed in amyloid pathology in vivo. Heatmap depicts increase in expression values calculated by long-RNA-seq (TPM values) in the HT22 samples transfected with 1–42 (Espinoza et al., 2007) vs 42–1 reverse control peptide (R) (heatmap columns), for these genes (Supplementary file 1) (heatmap rows). TPM values are normalized per row. Red color represents higher expression. (D) Upper panel: Experimental design for the amyloid toxicity assay and a control experiment testing recovery 24 hr after application of the stress stimulus to confirm return of gene expression levels to pre-stress levels. Lower panel: Confirmation through RT-qPCR of the expression differences of selected B2-SRGs identified in RNA-seq data to differ between HT22 cells transfected with 1–42 (Espinoza et al., 2007) and cells transfected with the 42–1 reverse control peptide (R) for 6 hr (Supplementary file 1). Statistical significance (p value threshold 0.05) is depicted as asterisk for expression in treated cells (Espinoza et al., 2007) greater than the expression in controls (R) (unpaired directional t-test, n = 4, error bars represent standard deviation from the mean). In the same graph, we include also expression levels of cells from the same experiment that were left to recover in standard medium without any peptides for 24 hr after the initial 6 hr application of the peptides (42-Rec and R-Rec). Expression levels in all genes tested returned to pre-stress levels. Asterisk depicts statistical significance as described above also for the comparison between 42-ctrl and 42-Rec-24h.


