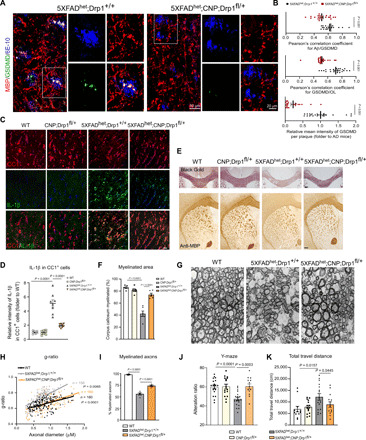
Fig. 4. Mature OL-specific Drp1 heterozygous knockout is protective in 5XFAD mice.

(A) Brain sections containing the corpus callosum from 6-month-old 5XFADhet;Drp1+/+ and 5XFADhet;CNP;Drp1fl/+ mice were stained with anti-GSDMD, anti-MBP, and anti-6E10 antibodies. (B) The colocalization of GSDMD and Aβ plaques (top) and the localization of GSDMD in MBP+OLs (middle) were quantified. The intensity of GSDMD in the Aβ plaque area was analyzed (lower). n = 3 to 4 mice per group. (C) Brain sections from 6-month-old WT, CNP;Drp1fl/+, 5XFADhet;Drp1+/+, and 5XFADhet;CNP;Drp1fl/+ mice were stained with anti–IL-1β (green) and anti-CC1 (red) antibody for immunofluorescence analysis. n = 4 mice per group. Scale bar, 20 μm. (D) The intensity of IL-1β in CC1+OLs was quantified. (E) Mouse brain sections were stained with the Black Gold II myelin staining kit (top) and anti-MBP for immunohistochemistry analysis (bottom). Scale bar, 200 μm. (F) The area of positive anti-MBP staining was quantified and is presented in the histogram. (G) The corpus callosum of each mouse of the indicated genotypes was harvested for TEM analysis. (H) The g-ratio of the myelin of the mice was measured. (I) The percentage of myelinated axons was quantified. (J) Cognitive activity was assessed in 6-month-old mice using the Y-maze. Nine female and 10 male WT, 8 female and 8 male CNP;Drp1fl/+, 9 female and 10 male 5XFADhet;Drp1+/+, and 7 female and 6 male 5XFADhet;CNP;Drp1fl/+ mice were used. (K) Movement activity was assessed in 6-month-old mice using the open-field chamber. The total travel distance of mice is shown. Six female and 6 male WT, 8 female and 7 male CNP;Drp1fl/+, 8 female and 8 male 5XFADhet;Drp1+/+, and 7 female and 7 male 5XFADhet;CNP;Drp1fl/+ mice were used. All the data are expressed as the mean ± SEM and compared by one-way ANOVA with Tukey’s post hoc test.
