
Fig. 5. Mature OL-specific Drp1 hyperactivation induces glycolytic stress in AD mice.
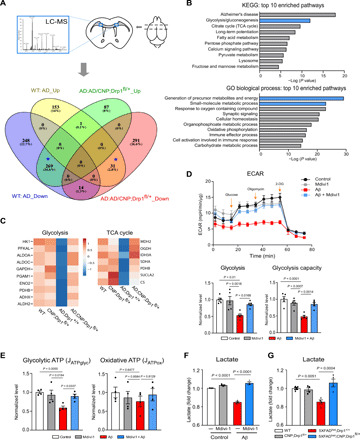
(A) The corpus callosum was harvested from 6-month-old WT, CNP;Drp1fl/+, 5XFADhet;Drp1+/+, and 5XFADhet;CNP;Drp1fl/+ mice (shown in scheme). Label-free tandem mass spectrometry analysis was conducted to identify the proteins changed by mature OL-specific Drp1 heterozygous knockout in 5XFAD mice. The number of proteins changed in mice of the four genotypes is shown. In particular, 269 proteins accounting for 24.6% of total identified proteins were decreased in 5XFAD mice but elevated in 5XFADhet;CNP;Drp1fl/+ mice. Thirty-one proteins were increased in 5XFAD mice and decreased in 5XFADhet;CNP;Drp1fl/+ mice. These 300 proteins were used for bioinformatics analysis. (B) The molecular and cellular functions of the 300 proteins from the pool marked as * in (A) were analyzed. The proteins were enriched for proteins involved in glycolysis and the TCA cycles and significantly regulated by mature OL-specific Drp1 heterozygous knockout. (C) Heatmap analysis for these enriched proteins is shown. (D) Mature OLs were treated with oligomeric Aβ1-42 for 24 hours in the presence or absence of Mdivi-1 (5 μM). The ECAR was analyzed with the seahorse analyzer (n = 2 replicates per group). The data are from four to five independent experiments. (E) Glycolytic and oxidative ATP production rates were calculated as described in Materials and Methods. (F) The lactate content of mature OLs was measured. The data are from at least three independent experiments. (G) Total protein lysates were prepared from the corpus callosum of mice with the indicated genotypes, and the lactate content was measured. n = 4 mice per group. The data are from at least three independent experiments. All the data are expressed as the mean ± SEM and compared by one-way ANOVA with Tukey’s post hoc test.